Climate Discovery Chronicles Archive 100111
August 4, 2011 Just a Reminder - The Alaskan Boreal Forest and the Amazon Have Both Flipped From Carbon Sinks to Carbon Sources ... See here February 28 and here February 4.
September 4, 2011 Unprecedented--In Time Frames that Matter: Whenever we have an extreme weather event, whether it be unprecedented in the historic record or not, the climate unchangers come out of the woodwork. They are at the ready with their cries of, "It's not unprecedented!" All the while, they appear to not be listening to what the scientists have to say. They are only concerned with the world knowing that the weather event in question is only a rerun of past weather events of similar proportions, be it in the historic or the prehistoric record.
The scientists, all the while, have known that these weather events have happened before--it is not important to the crisis at hand. It matters not if we had a super drought that was worse than our current drought in the 1300s, or the 1550s, or the 900s--really, it does not matter to our society today. There are 10 or 20 times more, or maybe even 100 times more people on the planet today then there were back then. We had a drought in the late 1800s that was worse than Dust Bowl by quite a bit, but do the climate scientists give a Hula-hoop? No they do not. At least, they realize that the past is irrelevant. Today we are burning our fossil fuels one million times faster than nature saved them for us. The implications for our society are much, much larger than the drought of the 1890s or the 1300s, or the 900s. Today we literally doing, in 100 years, what nature takes a million years to do. We are burning our fossil fuels one million times faster than nature saved them for us.
There were less than 1 billion people on Earth in 1880. Today there are nearly 7 billion. This is not the same planet. This drought that we are having in Texas today is totally extreme. Austin just experienced 32,000 acres of wildfires in two days that burned over 1600 homes to the ground. We had eighty, 100 degree days this year smashing the old record of 69 and we are just getting going with climate changes.
There is an ven more important issue that needs to be considered with these new climate change impacts that are "surprising" us. It doesn't matter if there was a similar drought in the 1800s, our society of 7 billion people did not evolve then. Central Texas has never experienced these types of fires, this type of heat or this extreme of drought--in time frames that matter. When I say time frames that matter, I mean since we have become a mostly urban society. Our food is all grown on mega mechanical farms. 21,000 dozen eggs fit into one 18-wheeler. A hundred 18-wheelers leave a typical egg factory every day. Things were different when we each grew our own eggs, captured our own water and stored it in our own hand-built underground cisterns.
If the radical skeptics would only listen a minute--I think this is one of their main problem. They have preconceived notions that they are certain are correct. And they are - the drought in the lat 1800s was worse than the Dust Bowl--but it does not matter today.
Take this drought again: They bring up their "sit down and shut up" point about another drought of this strength happening in the 1880s. The climate scientists responds, yes you are correct, and in the 1500s there was a drought twice this extreme. It happened again in the 1300s and 900s. Twice as bad! But wait, there's more: two or three times (I can't remember) since the end of the last ice age, we have had megadroughts that saw only 10 to 15 percent of what we call "normal" rainfall, and this went on for 200 to 300 years.
No, I am not finished yet. All of this stuff above happened in the last 10,000 years--what we call an interglacial warm period. These interglacial warm periods are very stable warm periods, lasting usually only a couple of thousand years, each between 100,000 year long ice ages. These droughts and super droughts all happened during the interglacial warm periods. Droughts during the ice ages put super droughts and mega droughts completely to shame.
There was so much dust on the planet during the ice ages that this is the main way that annual ice layers are identified in polar ice cores. This dust blew all the way from the deserts of Siberia to the Greenland ice sheet where we use it to identify time spans. But who cares?
Climate change is about the normal weather that we have had for about two hundred years, where we have learned to make enough food, harvest enough fish, chop down enough trees to manage our society. A few degrees of change will mess all of this. The droughts and fires and tree kills that we are experiencing because of this series of droughts that we are experiencing in Texas is far beyond anything that we our society has experienced. Certainly, we have seen Texas transform itself from a forest to a desert. Our great oak forests were once border to border pine forests. Shifting sands once covered vast areas of the state.
In the last two hundred years though? Nothing of the sort. We have had a few droughts that were worse, or as bad as the Dust Bowl, but they happened when we had a global population of less than a million and we all grew our own eggs. What the radical propaganda believers can not hear is that it simply doesn't matter how similar that historical or prehistoric weather event was. What we are seeing today is only a prelude.
We have seen our CO2 concentration increase. We know that this causes warming. We have experienced some of this warming and we think we know where the rest is hiding because we still do not understands clouds and some feedback mechanisms very well. We know that the warming could not possibly be all caused by the sun or solar cycles. The sun cycles too quickly to be responsible for more than a teeny bit of warming and solar cycles cycle far too slowly to have an influence. We know that cosmic rays, even though we still don't know enough about clouds, have little effect on climate.
We know that we are doing relatively nothing to reduce greenhouse gas emissions and that because of this we can expect to see an additional 5 degrees of warming (about)--if we stopped emitting all greenhouse gases tomorrow. And we know that we are seeing some really big ecosystem changes already with only 1.4 degrees of average global change.
What the scientists see then, is that the relatively unprecedented nature of these extreme weather events that we are experiencing today will not be very big news in a decade or two. Instead of Texas breaking the all time 12 month minimum rainfall record (11.4 inches), and then things returning to normal (33 inches), we will simply not return to normal.
In the last five years, our drinking water supply, the Highland Lakes, has gone from being overfull to breaking a 60 year record for dryness--not once, but twice. This has happened because we are seeing a longer warm period because of warming. Evaporation has a nearly exponential function, which means that as it gets warmer, evaporation increase a lot, lot more for every little bit of warming. Drought can actually be perpetuated with normal rainfall if the warm season increases in length.
These climate change weather events are NOT unprecedented in time; They have happened in the past. the problem is--the future has not happened in the past. Seven billion people without water to send 15,000 dozen eggs pre 18- wheeler to market every day 100 times per egg farm .. what are we going to do with the water to raise those chickens?
August 20, 2011 Permian Extinction Included Massive Forest Die-off Caused by Abrupt Climate Change Fungus:
"The death of the forests – primarily comprised of conifers, which are distant relatives of today's pines and firs – was part of the largest extinction of life on Earth, which occurred when today's continents were part of one supercontinent, Pangaea. The so-called Permian extinction likely was triggered by immense volcanic eruptions in what is now Siberia. The huge amounts of gas and dust thrown into the atmosphere altered global climate, and some 95 percent of marine organisms and 70 percent of land organisms eventually went extinct."
"The researchers acknowledge that conifer forests probably suffered from other environmental stresses as a result of the long-term volcanic eruptions, which spewed carbon dioxide and methane into the atmosphere and likely destroyed some of Earth’s protective ozone layer. Nevertheless, they wrote in their paper, “… whatever (the) sequence of events that triggered ecosystem destabilization on land, the aggressiveness of soil-borne pathogenic fungi must have been an integral factor involved in Late Permian forest decline worldwide.”
It took conifers 4 to 5 million years to recover form the end of Permian extinction--just saying...
http://www.physorg.com/news/2011-08-climate-tree-killing-fungi.html
Berkeley Press Release: http://newscenter.berkeley.edu/2011/08/05/fungi-helped-destroy-forests-during-mass-extinction-250-million-years-ago/
August 19, 2011 The Volcano vs. The Anthropocene - An Epic Climate Change Myth: This is a big one. The myth that volcanoes emit more CO2 than mankind is an old one, and old climate change myths die hard. The science concerning greenhouse gases and volcanoes is robust, yet a few stale papers continue to give the climate pretenders hope that it will all just be a bad dream (or whatever it is that they are hoping for.) The propaganda wielders continue to wave the defunct flags of their fallen scientists regardless of the magnitude of the rebuttals to their misguided science.
An article in EOS, the Transactions of the American Geophysical Union has looked at all of the available literature on the subject and found that what the non-believers believe is non-science. This article was written by a retired USGS volcanic gas physicist. The reality of volcanic emissions is that they generally emit no more greenhouse gas than U.S. states like Florida or Wisconsin. Compared to annual global GHG emissions, mankind emits 135 times more than a typical volcano. Even more revealing, the massive Siberian flood basalt events 250 million years ago released 0.5 percent the greenhouse gases of mankind. WE would need to see 700 Mount Pinatubo eruptions in one year to equal annual global GHG emissions. Mankind's GHG emissions are so large that the only way that volcanoes could emit more is if there were a supervolcano eruption the size of the one that created the Yellowstone Caldera 2 million years ago--every year. these type of supervolcanos, the largest of their kind, only happen every 100,000 to 200,000 years.
Gerlach, Volcanoes vs. Anthropogenic Carbon, EOS, June 2011. http://www.agu.org/pubs/pdf/2011EO240001.pdf
August 18, 2011 Ice Shelf Collapse Increases Collateral Ice Loss for
Decades: The National Snow
 and
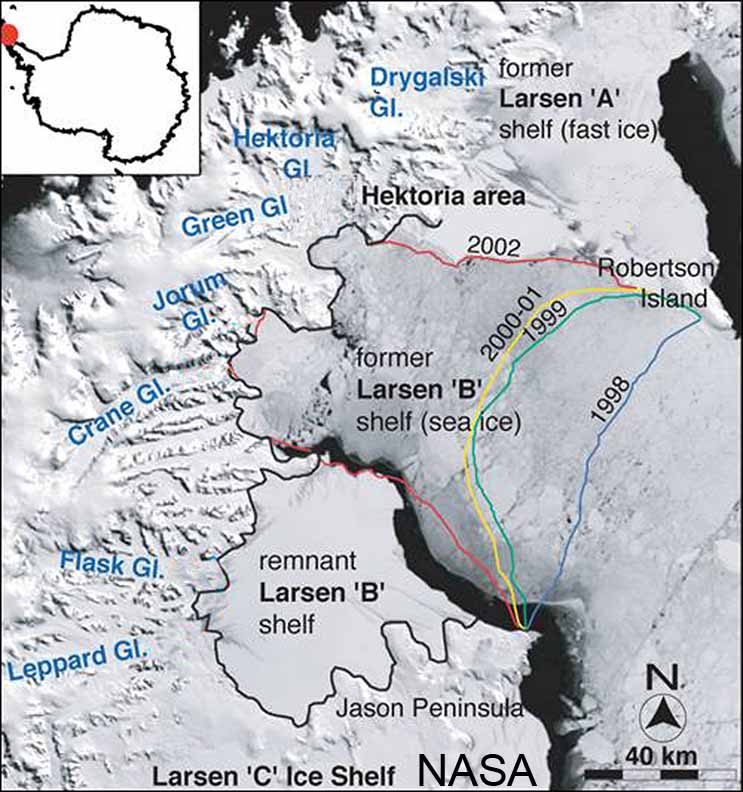
Ice Data Center has completed a big evaluation of the Larson Ice Shelf. You
may remember the Larson B -- it collapsed in 2002 in a colossal way. An area
the size of Rhode Island collapsed in about 30 days. The collapse was caused
by increased meltmater draining onto the crevasses of the ice shelf. The
increased melt water created a gravity wedge that drove the crevasses
entirely through the ice shelf causing the spectacular collapse. the
collapse could have been enhanced
by melting beneath caused by warmer ocean waters.
and
Ice Data Center has completed a big evaluation of the Larson Ice Shelf. You
may remember the Larson B -- it collapsed in 2002 in a colossal way. An area
the size of Rhode Island collapsed in about 30 days. The collapse was caused
by increased meltmater draining onto the crevasses of the ice shelf. The
increased melt water created a gravity wedge that drove the crevasses
entirely through the ice shelf causing the spectacular collapse. the
collapse could have been enhanced
by melting beneath caused by warmer ocean waters.
The ice shelf created a dam that held back the mountain glaciers feeding the Larson B. After the collapse the amount of ice dumping into the Arctic ocean from these feeder glaciers increased by up to 8 times. Sixteen years after the collapse of the Larsen A Ice Shelf, just north of the Larsen B, the outlet glaciers there are still showing elevation losses meaning that their discharge continues at an accelerated rate.
The latest evaluation of gravity satellite data for the period shows that ice loss has likely been two to three times greater than was previously understood. What we first understood to be losses of about 17 gigatons per year is now more like 41 gigatons per year. Since the Larsen B disintegration in 2002, the remaining smaller portions of the ice shelf continue to collapse. About half again as much has broken off of the remnants of the Larsen B Ice Shelf since 2002 as was initially involved in the Rhode Island sized collapse.
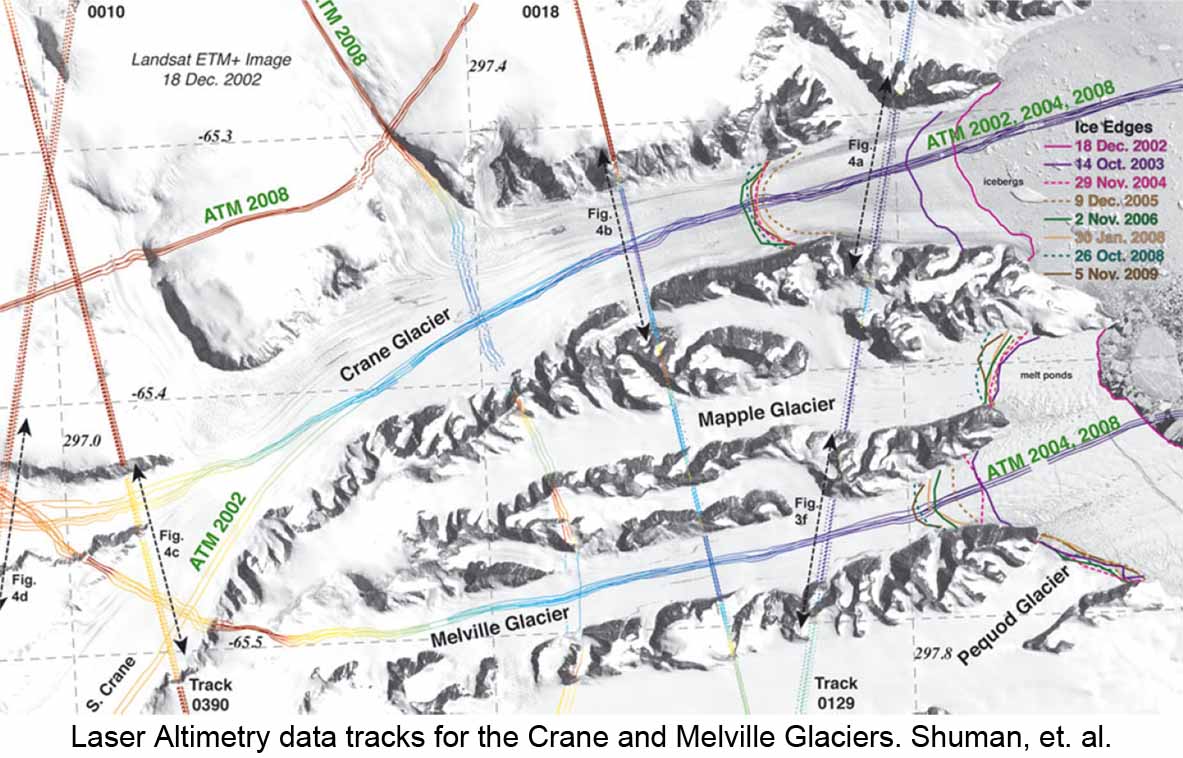
Elevation losses to the outlet glaciers for Larsen B have been as high as 500 feet since 2002.
National Snow and Ice Data Center Press Release: http://nsidc.org/news/press/20110725_iceshelf.html
Shuman, Berthier and Scambos, 2001 to 2009 elevation and mass loss in the Larsen A and B embayments, Antarctic Peninsula, Journal of Glaciology, July 2011. http://www.igsoc.org/journal/current/204/j10J164.pdf
Breakup of the Larsen B - NASA animation: http://earthobservatory.nasa.gov/IOTD/view.php?id=2288
August 15, 2011 Easier than We Thought - Solving the Climate Crisis: For the same reasons that "Those people who would have us distrust our climate scientists" tell us that climate change is either: not real, not as bad as the climate scientists say or will be good for the planet and her peoples, the solutions to climate change will be easier than public knowledge suggests.
We really do need some good news about climate change. and here it is - believe it or now, just like the rest of what I report: Not only will the solutions be easier than we have been led to believe, but the results will be vastly profitable for mankind. Not only will there be profits instead of costs, but the profits will be greater than any industry in the history of mankind. This will not be the "energy too cheap to meter" promise of nuclear power. This time, indeed, things are very different.
Our society is poised for a change. We have ridden the fossil fuel train about as far as the tracks extend. The tracks will be extended in the future, that is for certain, but the costs of business as usual will continue to increase. We are at place in time where we have been before. When coal took the place of wood as the primary fuel for civilization, we made a great leap. When oil came on the scene, we made another great leap. Now we are about to see the cost of alternative energy sources fall below that of our traditional fossil fuels. This will lead to yet another breakthrough in our society, one that I would like to believe is far greater than the transition from wood to fossil fuels.
The transition this time will be no less fantastic than before, and because there are ten times as many people on this planet than before, the results could certainly be even greater than before. I truly believe that this is the beginning of the third age of enlightenment. Just think of a world fueled by clean energy, costing less than traditional fossil fuels.
So, how can I say this when the media and all of those anti-climate change people keep telling us that fixing our broken climate will be too expensive (and curiously, at the same time they tell us that climate change is not real.) Well, I do not have any scientific findings to show you this time. No academic magic, not professorial papers. What I have this time is plain old common sense.
It should be fairly obvious to you if you have read more than a few of the entries in this journal, and it was likely obvious to you to begin with. Our climate is changing rapidly. It is because of mankind's fossil fuels emissions and it will destroy our civilization as we know it if we do not do something about it really soon. We are in big trouble right now, much sooner than we have been led to believe we would be in trouble. The reason this is all happening so much more quickly and with greater impacts is very simple. Twenty years ago, when the climate scientists told us we should act, we did not. They told us back then that the longer we waited to act the greater the challenge would be to bring our climate back under control. They were not wrong.
But scientists have reticence. This reticence, something common in science land, has caused them to do two things. Both of these things are done so that the scientists minimize the risk of losing credibility. They err on the conservative side of any discussion because if they are wrong their credibility is tarnished. They do not go out on limbs. They do not push the envelope too far. They try not to find themselves in a pickle. Being wrong too many times results in their credibility being destroyed--the climate journals will no longer accept their papers for publishing and as the old saying goes, they perish.
As you have seen in these pages, when reporting climate discoveries, the scientists err on the conservative side. The reason is that; the worse their predictions become, the more alarmist their predictions are, the greater is the perceived chance of failure--of being wrong. This is a fundamental challenge in science and climate science is no different. How does a scientist really tell it like it is without reticence? He or she does not, it is that simple. They have their careers and families to protect. Would you do any different?
So their findings of climate change impacts are reported conservatively. Now consider scientific discoveries about new energy alternatives, atmospheric carbon capture and carbon sequestration in the oceans, in saline aquifers, in periodontine rocks and as mountains of calcium carbonate on the surface. These findings are all reported conservatively too. This means that the new energy alternatives will be easier to develop, cheaper to deploy and more efficient than what the media is reporting from the scientists press releases based on their academic publishing. It means that atmospheric carbon capture will be easier and cheaper and more efficient, that sequestration in the oceans, saline aquifers and periodontine rocks will be easier and cheaper and more efficient and disposal as mountains of calcium carbonate will be easier, cheaper and more efficient . . . than what the media reports.
Now consider that "those people who would rather we all distrust the climate scientists" (I am not talking about the vast majority of those people, just their leaders--we know who you are), "those people . . . " spread propaganda that exaggerates facts. They exaggerate the few scientific findings that downplay the impacts of climate change. They exaggerate the statements of "their" scientists even, who say that climate change is not real, and . . . they exaggerate the costs of fixing our climate.
I have read a lot of climate science findings that talk about the fixes, the new technologies in the lab, on the proving bench and in the scale test stages. This is not my area of specialty, but I can draw conclusions here and there beyond this common-sense intuitive thinking that "those people . . ." are repeating propaganda that exaggerates the costs of fixing climate. It all just makes so much sense to me - why would "those people . . " NOT exaggerate the other side of the coin? Those propagandist responsible would not just stop at discombobulating the facts about climate change impacts and future projections. Why would they do this? It's propaganda! They need every straw horse they can find.
So we have two levels of magnification happening in the climate change solutions challenge. One is the tendency for reticence among scientists. The other is the tendency towards exaggeration by "those people who would rather we not trust our climate scientists." Put them together and subtract them from what the climate scientists findings report and the solutions to climate change will not be very difficult, they will in fact be very easy.
One caveat though, a good scientists always has his or her caveats: We do have time limits. Twenty years ago we were warned that as time goes by, climate change would get worse faster if we did nothing. We have done nothing, and what they told us twenty years ago is now turning out to be true. These guys and girls are still telling us this, only now they have done things like change the goal posts on us because we have failed so greatly at taking action when they told us to. Now they say that the threshold to dangerous climate change is 1 degree C instead of 2 degrees C. They say we only have a decade, not to begin actions, but to get actions fully implemented. They say that we need to limit our atmospheric carbon dioxide concentration, not to 550 ppm (1990s) or 450 ppm (early 2000s) or 350 ppm (2008). Now the safe operating level of CO2 for our planet is 300 ppm CO2.
It's not likely to fall further because the preindustrial level of CO2 was about 280 ppm, or will it? I can only read a couple of thousand papers a year, but what I have to say now, I would like to credit to the opening of my mind that this great climate change challenge has led me through. We must all think differently than we have in the past. We may indeed need to draw down atmospheric CO2 below the preindustrial level of 280 ppm because we may have already overshot.
August 14, 2011 Somali, Ethiopia and Kenya - The Most Severe Food Shortage Security Emergency in the World Today: An article in Nature News, in the journal Nature, describes the prediction of this famine and it linked to climate change. Last summer, the Famine Early Warning System Network (FEWS NET) set up by the US Agency for International Development to help policy makers prevent humanitarian disasters, predicted this major and growing famine.
At risk right now are 12.4 million people; this is the worst drought in
Africa in 60 years. One quarter of the Somalia population has been
displaced. 1,500 refugees are fleeing Somalia to Kenya every day. Most of
them go to Dadaab, a refugee camp built for 90,000 in 1991. Over 400
thousand refugees are in Dadaab right now.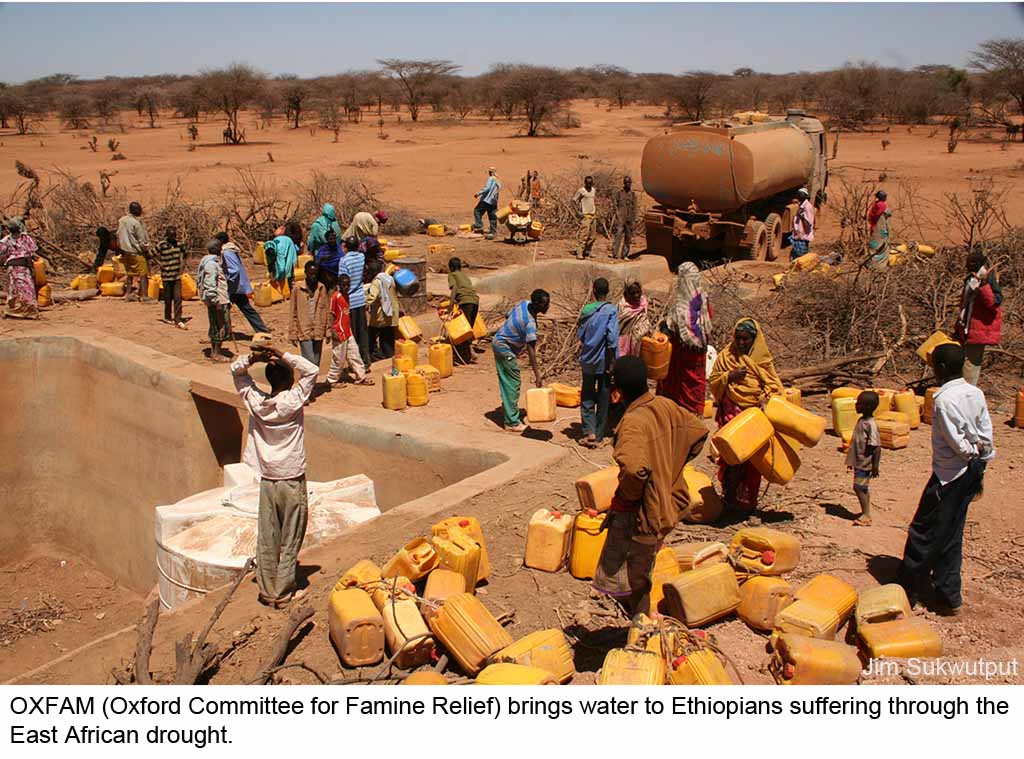
When the 2010/2011 La Nina was forecast the FEWS NET made their prediction of famine in east Africa due to extreme drought. Three factors added up to allow them to draw this conclusion. First, La Nina's are generally associated with drought in east Africa from October to December. Second, the weakened rains around the Horn of Africa in the late 2000s in combination with high food prices had, as the article says, "weakened the population's resilience to food emergencies." Third, research has shown that ongoing climate induced warming in the Indian Ocean is linked to drying of March-to-June rains in East Africa.
As anticipate, the fall rains failed nearly completely. then the spring and early summer rains failed. In 1984, a million people died in the great famine in Ethiopia and Sudan. Conditions are quickly worsening. The price of maize in Kenya has increased by 246 percent. the value of a goat, common used to barter for maize, has fallen by 50 percent. FEWS NET reported on June 7 "This is the most severe food security emergency in the world today, and the current humanitarian response is inadequate." The article states "Famine conditions are expected to spread farther across Somalia, and large areas of Kenya and Ethiopia could see food availability fall to crisis levels. In all, some 11.5 million people across East Africa need emergency assistance."
Natural Cycles? Natural cycles that are increased in intensity by a growing population? Sure, this could be so. But, that was when we were playing by the old rules. The lessons of climate change are true all across the globe, not just in Africa. What were once just natural climate cycles, at the very least, are now enhanced by climate change. But more concerning, what we once could expect from natural cycles on our old, pre-climate change Earth, are in many cases no longer applicable.
Our old natural cycles were based on a stable climate state. We could expect the natural chaos of everyday weather to fall within accepted known's. These knowns can be thought of in the context of a one-hundred years storm. On average, a one-hundred years storm occurs every one hundred years, just as do a one-hundred year drought, a one-hundred year snowstorm and a one-hundred year flood. Even more extreme were the five hundred or one-thousand year storms, or what meteorologist call the possible maximum precipitation event.
The frequency of reoccurrence of these "storms and floods" and such has been based on real weather events, or evidence of such events and statistical analysis evaluating their reoccurrence. This reoccurrence of course would be 100 years for a 100-years storm (always understanding that a 100-year storm occurs on average only every 100 years.) It may be obvious to you now that we really don't yet have 100 years of really good weather observations, like we can get from modern weather stations and satellites, but our scientists are pretty clever people.
The can take the "high resolution" weather data that we do have and compare it to older and older weather observations and sort of "fill in the blanks." Statistics work really well when one is working with a stable population. Predictions can be made with high accuracy. This is what I am referring to when I saw "old rules." We have had a remarkably stable climate for about 10,000 years, more so than at any time in the last 400 thousand years, and possibly more stable than anytime in the last three million years or more.
So now that our climate is changing more rapidly than anytime in the last 610 million years, we have proceeded beyond this stable climate state. In effect, we are playing by "new rules." But the last 10,000 years hardly matters. It is the last 250 years, or even the last 100 or 50 years that matters. Our civilization has evolved with an extremely stable sea level and relatively moist areas across the interior of most of our large continents where we grow much of the food that the world eats. Our coastal populations, which amount o nearly half of the world population depending on what one thinks of as "coastal", evolved with stable populations of seafood and many areas or the globe are exceedingly dependent on snowmelt from winter mountain snows that serve as their only water source.
When humanity's population was only a billion (circa 1800), the carrying capacity of the planet was greater. When our population was that small we were much more of an agrarian society. Even up until The Great Depression and World War II our population had only risen to a little over two billion. Since then our population has tripled and just in the last forty years it doubled. Today with a global population 6.7 billion the carrying capacity of the planet is more in question than ever.
New climate rules make the challenge all the more urgent. We have a fair idea of what our climate was like at various times in the past, but that was when those climate were relatively stable. We also know what the IPCC says about regional climate change, but this information is based on climate science prior to 2005 when they stopped taking papers. Since then we have developed much high resolution regional climate models, but they too are mere representations of our future climate. The latest IPCC report suggested that East Africa would become wetter, and it still may, but more recent modeling backed up the actual weather trends show drying in east Africa.
We may have an idea of what will happen, but it's only an idea. A more robust finding of climate science though is that our current weather patterns will intensify with wetter areas getting wetter and drier areas getting drier. Now, through in the natural cycles and amplify the enhancements to our weather promised by climate change. You see, it's not really the few degrees of change that will disrupt our civilizations evolution. Even ten degrees of warming would not be so bad. (well maybe in Texas.) It is the amplification of weather extremes that will be our undoing.
Forests don't die from being a little warmer, they die from extreme drought. The interior of continents don't desertify because of a little warming, they desertify because extreme drought kills all the plants, then there is nothing left to hold the soil and nothing left to promote cloud formation and rain once a little moisture does return.
http://www.nature.com/news/2011/110803/full/476007a.html
August 10, 2011 China to Cap Greenhouse Gas Emissions, The U.S. Continues to Do Nothing China may not be leading the world in climate change policy, but, er, neither is the U.S. China's emissions grew 75 percent in the five years from 2002 to 2007 and in 2010 their emissions grew 10.4%, even with the world-wide recession. Now China proposed emissions cap is getting closer to approval and they have settled (for now) on allowing a 25% increase in emissions in the next five years. Of course it is nowhere near enough, but at least it is something and that is my point.
The U.S. has no cap. Climate scientists have been telling us for decades that we need to have our atmospheric CO2 level 7% below 1990 levels. The United States and the United States alone laughs in their face. Every other country on the face of this planet agreed to Kyoto.
China's automobile mileage standards have been higher than those in the U.S. since, well, since China had cars
27.5 mpg standard that was established in the early 1980s under the Corporate Average Fuel Economy (CAFE) program. U.S. 34.1 by 2016 and 54.5 by 2025
China's emissions grew 75 percent in the five years from 2002 to 2007 and in
2010 their emissions grew 10.4%, even with the world-wide recession.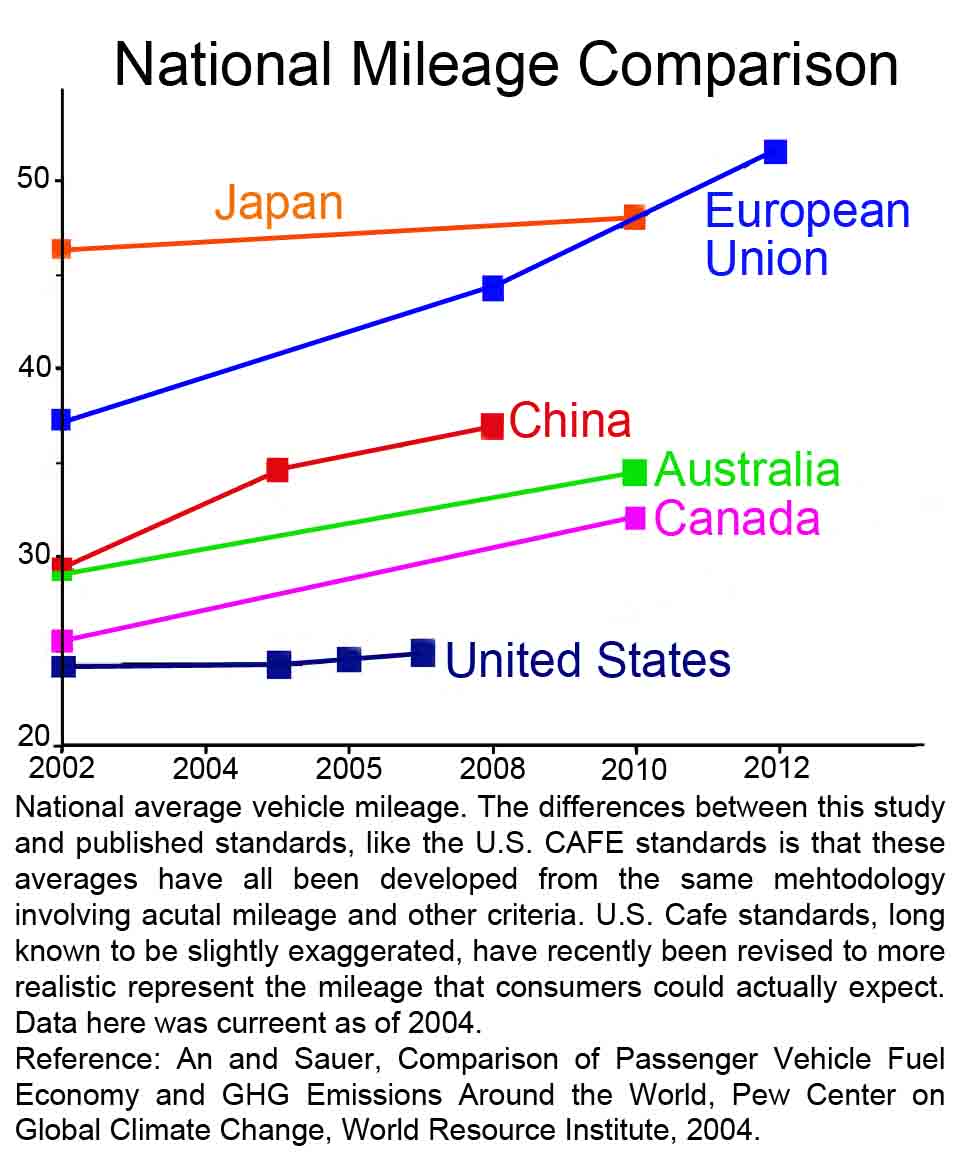
China 2002 3.691 get 2007 6.533 gt = 76%
Comparison of passenger Vehicle Fuel Economy and GHG Emissions Around the World, Pew Center on Global Climate Change, 2004. http://www.pewclimate.org/docUploads/Fuel%20Economy%20and%20GHG%20Standards_010605_110719.pdf
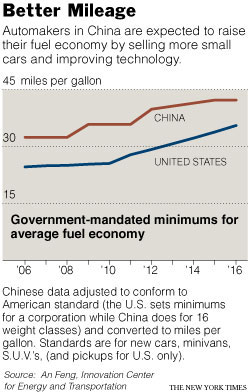
Other studies put current Chinese mileage at 35.8mpg – so China has already surpassed the requirement that Obama wants to implement in 6 years. And Chinese officials have announced a new target of 42.2 mpg by 2015
The Guardian: http://www.guardian.co.uk/environment/2011/aug/04/china-cap-energy-plan
Cafe Standards: http://www.npr.org/templates/story/story.php?storyId=125458204&ft=1&f=1007, http://www.nytimes.com/2009/05/28/business/energy-environment/28fuel.html?_r=1 http://www.reuters.com/article/2009/03/28/us-usa-autos-efficiency-idUSTRE52Q3J820090328
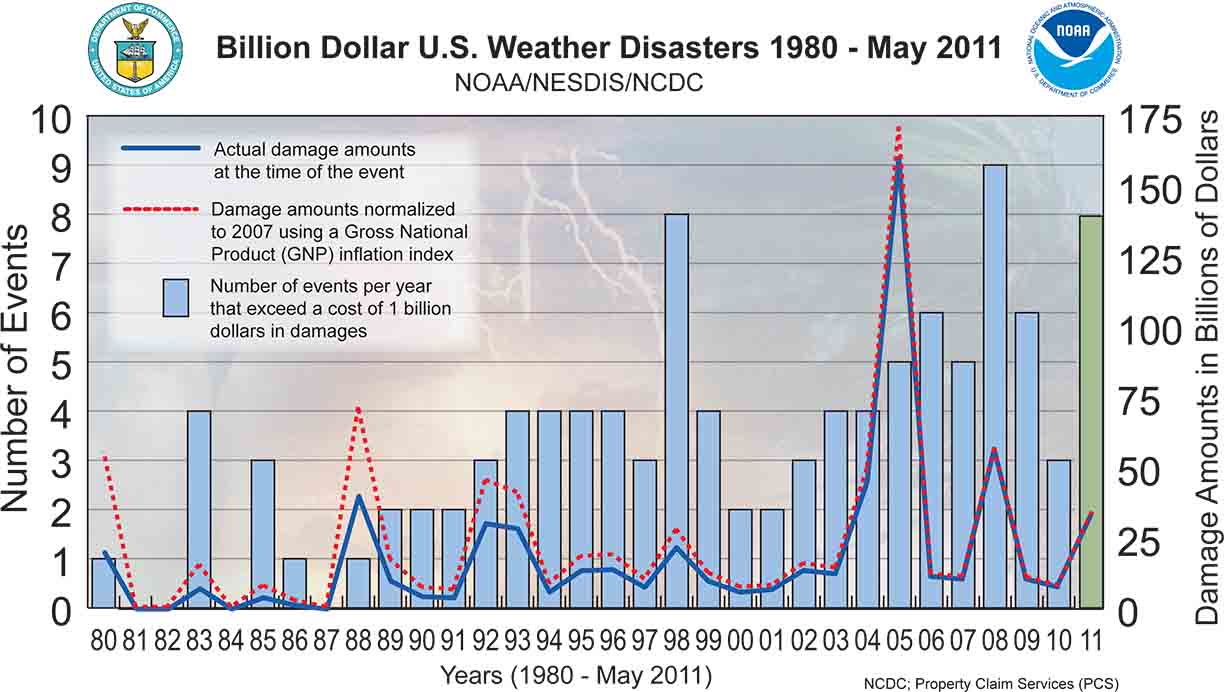
August 8, 2011 National Climatic Data Center $32 billion in Disasters in 2011 FRM NCDC "2011 represents the highest damage cost-to-date in the U.S. for any year since 1980 when we began tracking Billion-dollar disasters. Economic damage costs to date in the US approach $32 Billion. The damage cost-to-date in the U.S. from natural disasters is typically less than $6 Billion, from the usual combination of winter storms, crops losses due to cold weather, springtime flooding and severe weather outbreaks."
http://www.ncdc.noaa.gov/oa/reports/billionz.html#narrative
August 7, 2011 One 400 square mile (huge) tundra fire in Russia equals one year of Natural Carbon Sequestration for All of the Arctic
http://www.sciencedaily.com/releases/2011/07/110727131407.htm
http://www.reuters.com/article/2011/07/29/us-tundra-fire-study-idUSTRE76S5VY20110729?feedType=RSS&feedName=environmentNews&utm_source=feedburner&utm_medium=feed&utm_campaign=Feed%3A+reuters%2Fenvironment+%28News+%2F+US+%2F+Environment%29
August 3, 2011 New 30-year Climate Averages Obscure Climate Change
Even More: Every ten years NOAA recalculates their average
temperature. the average temperature is what we hear every night on
television when the weathergirl says "the normal low temperature today was
fourtysomething (or whatever)." NOAA, the parent organization of the
National Weather Service, supplies these "normal temperatures. They are
based on the average temperature for the high or low, day, month or year
based on the last 30 years of actual temperatures.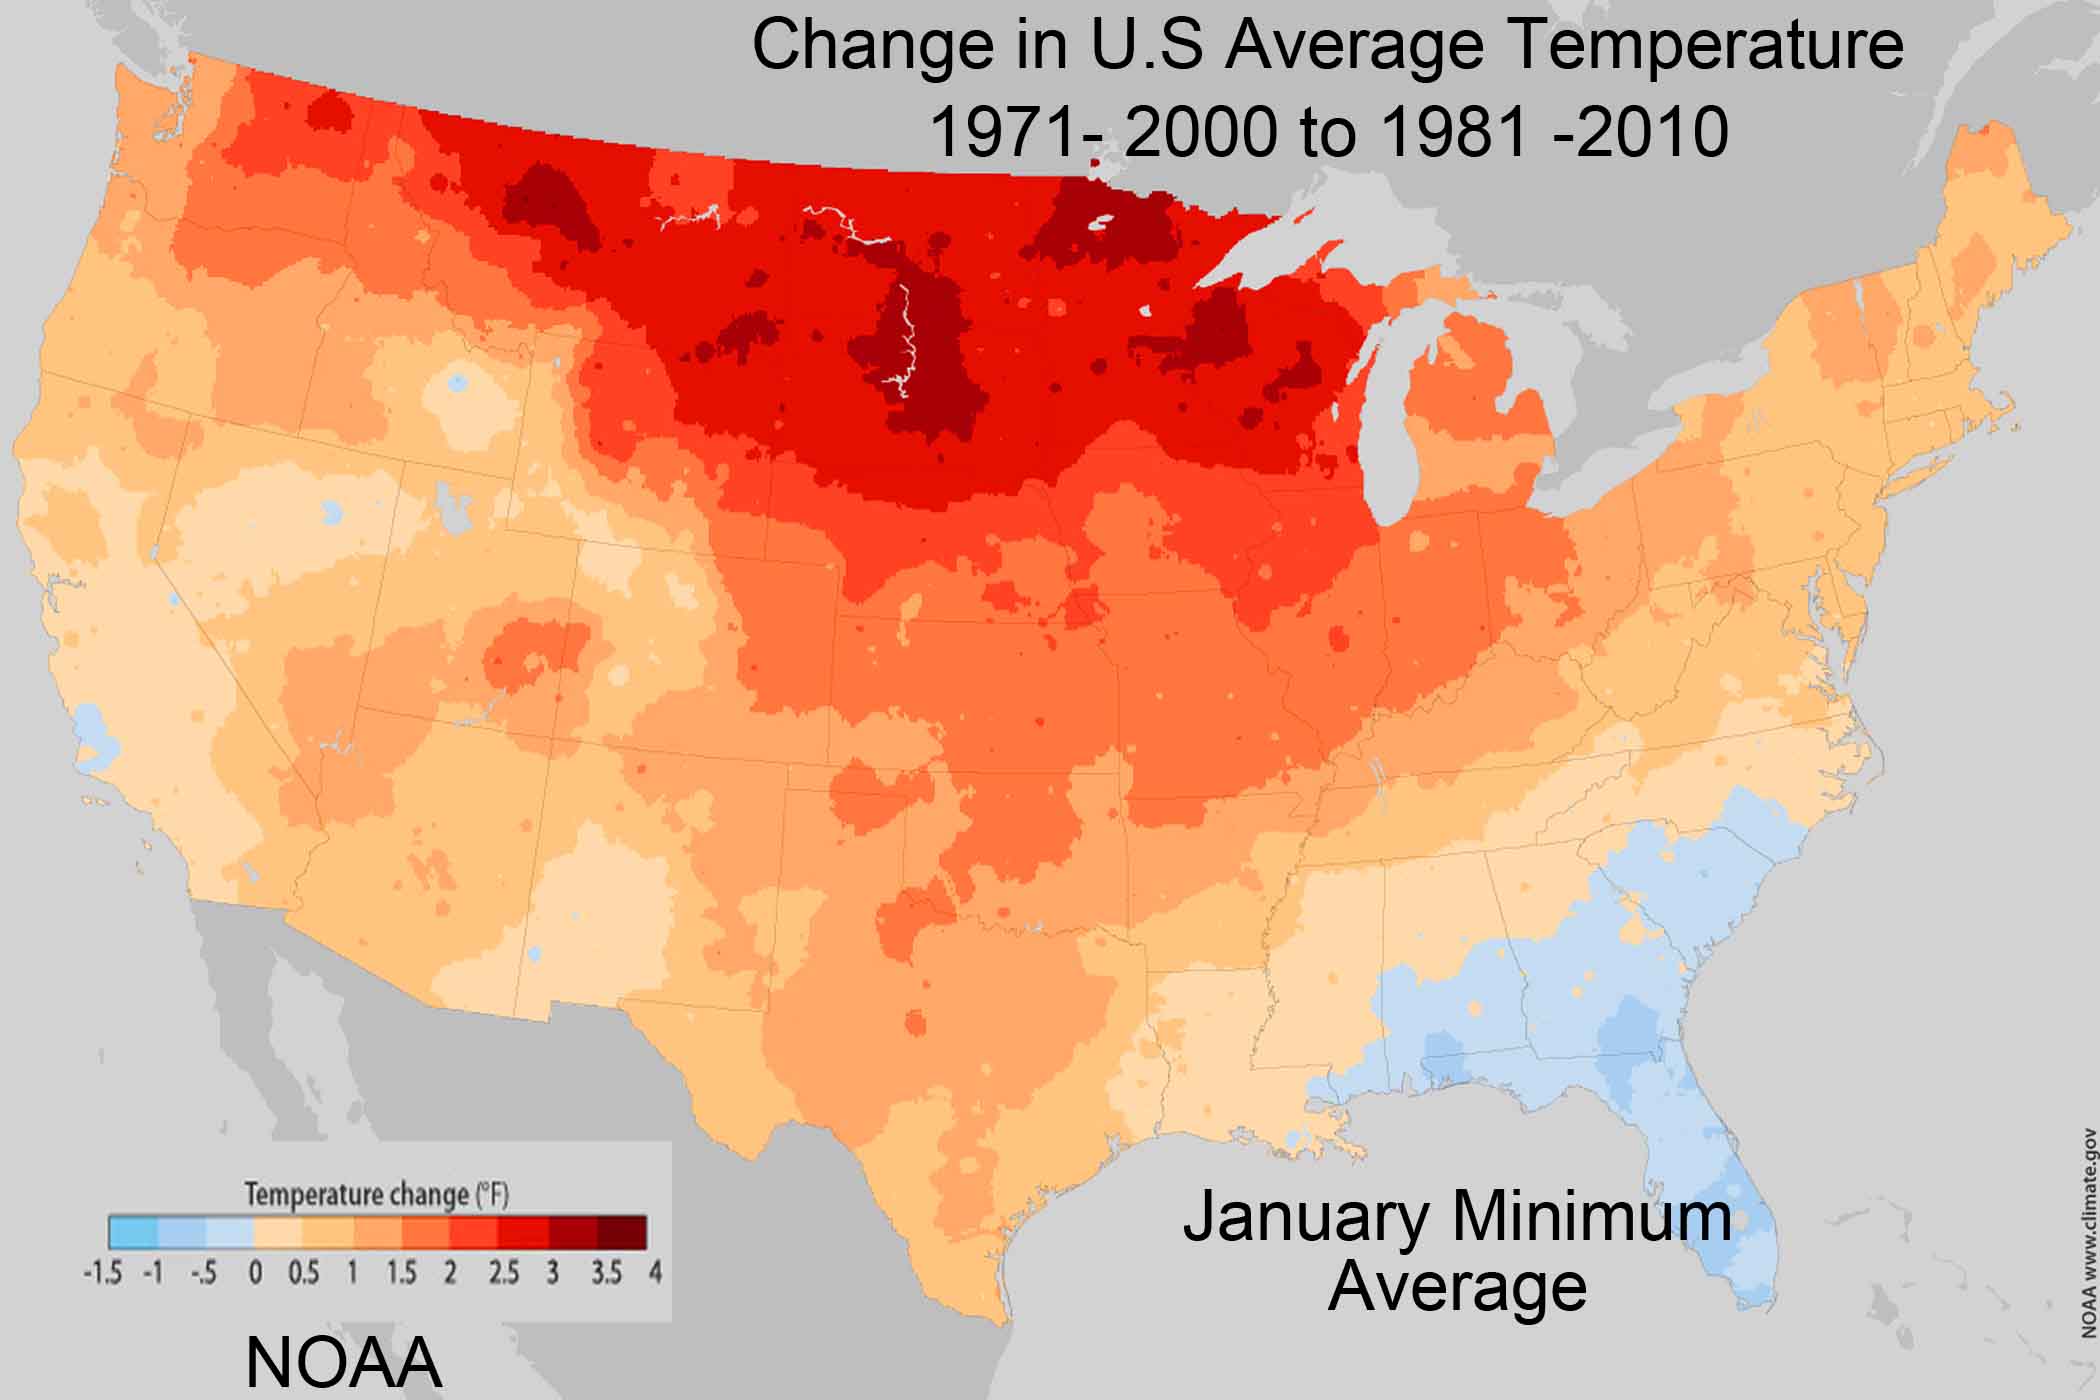
So now the new average temperatures reflect ten more years of global warming and these last ten years have really seen those temperatures warm. So every night on weather, when we hear what the normal temperature for the day is, that normal temperature has been influenced by global warming, yet it is presented as "normal." How fair is this? How much does this confuse the issue?
How much, it could not be that much, could it? the image from NOAA below shows exactly how much warmer the minimum January temperature is across the nation in the thirty years averaged 1981 to 2010 vs. 1971 to 2000. In the Northern tier of states the average "normal" temperature is now about 3 degrees warmer. In Austin, when I heard about this news on the second of August, the television weatherman told us that the old normal high temperature for August second was 95 and the new normal temperature for August 2 was 98. How fair is that? We are having one hellofa time trying to convince the public how significant just a few degrees of warming is and the national Weather Service goes and changes the goal post by three degrees! What the hell are they thinking? This is NOT normal, this is outrageous! Just because we have been doing this for a hundred however many years does not mean that we should continue to do so. NOAA and the National Weather Service should change to meet the demands of the 21st century.
http://www.ncdc.noaa.gov/oa/about/whatsnew.html
July 20, 2011 247 of Texas' 254 counties are under Texas Forest Service burn bans. In Austin we have only had 50% of our normal annual rainfall (9 inches behind) and we are about 60 percent behind for the last 10 months. We have had 36, 100-degree days so far this year and our normal is 12 days above 100-degrees. It was 102 degrees on my second story back porch this morning at 11:30 a.m., in the shade, on the north side of the house. It rained for thirty minutes yesterday but the driveway never became completely wet.
July 11, 2011 Sea Level Rise Acceleration Continues: Our Oceans are Rising Faster and Faster
Climate science moves ahead. Recent findings continue the increase in
the rate of sea level rise (Grinsted, Moore, and Jevrejeva, 2009; Jevrejeva,
Grinsted, and Moore, 2009; Rahmstorf, 2007; Vermeer and Rahmstorf, 2009.)
It is not just that sea level continues to rise, the rate that it is rising
is increasing.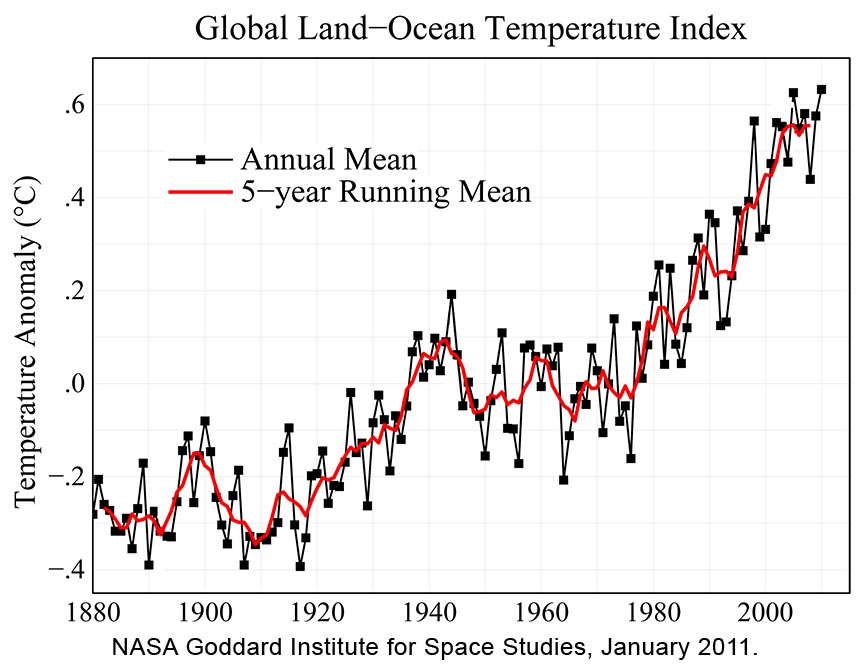 In other words, as our climate continues to warm it is melting more ice
faster, so sea level is rising faster.
In other words, as our climate continues to warm it is melting more ice
faster, so sea level is rising faster.
These findings have been questioned by a paper by Houston and Dean at the U.S. Army Corp of Engineers. Houston and Dean say that sea level rise rate is stable, not increasing - not accelerating. Four recent papers tell us sea level rise is accelerating, and then one tells us it is not.
This is the way science works. We discover new things that tell us clues about how our planet is behaving, then we find more clues, then we find something that seems to disagree. Then, as is often the case, we find that the skeptical arguments were not really what we thought they were.
Houston and Dean may or may not be duplicitous in their participation in this issue, but they do continue to defend their proclamation even after the errors of their analysis have been pointed out.
In this case, "those who would rather we not believe the vast majority of climate science" once again raised the media alarm far and wide to claim that climate change science, as the AGW fanatics know it, is dead and this one little sea level rise paper proves it. But as I said, this is not the case and unfortunately, the AGW crowd, or I should say, climate scientists in particular, do not have the media connections, or necessarily the training to create a media event of similar magnitude as "them." So, the news that the this paper's findings that sea level rise is not increasing, gets massive press, but its refutation gets no notice, no press, no acclaim.
What happened (this time) was that Houston and Dean looked significantly at
Northern Hemisphere data and largely at U.S. data. Because much of the
land mass in the Northern Hemisphere is still rising after the recent
melting of the big ice sheets from the last ice age 10,000 years ago, much of the
Northern Hemisphere sea level signal is relatively
static and the Southern Hemisphere carries the global average, but this is
just the first inappropriate use of data by Houston and Dean.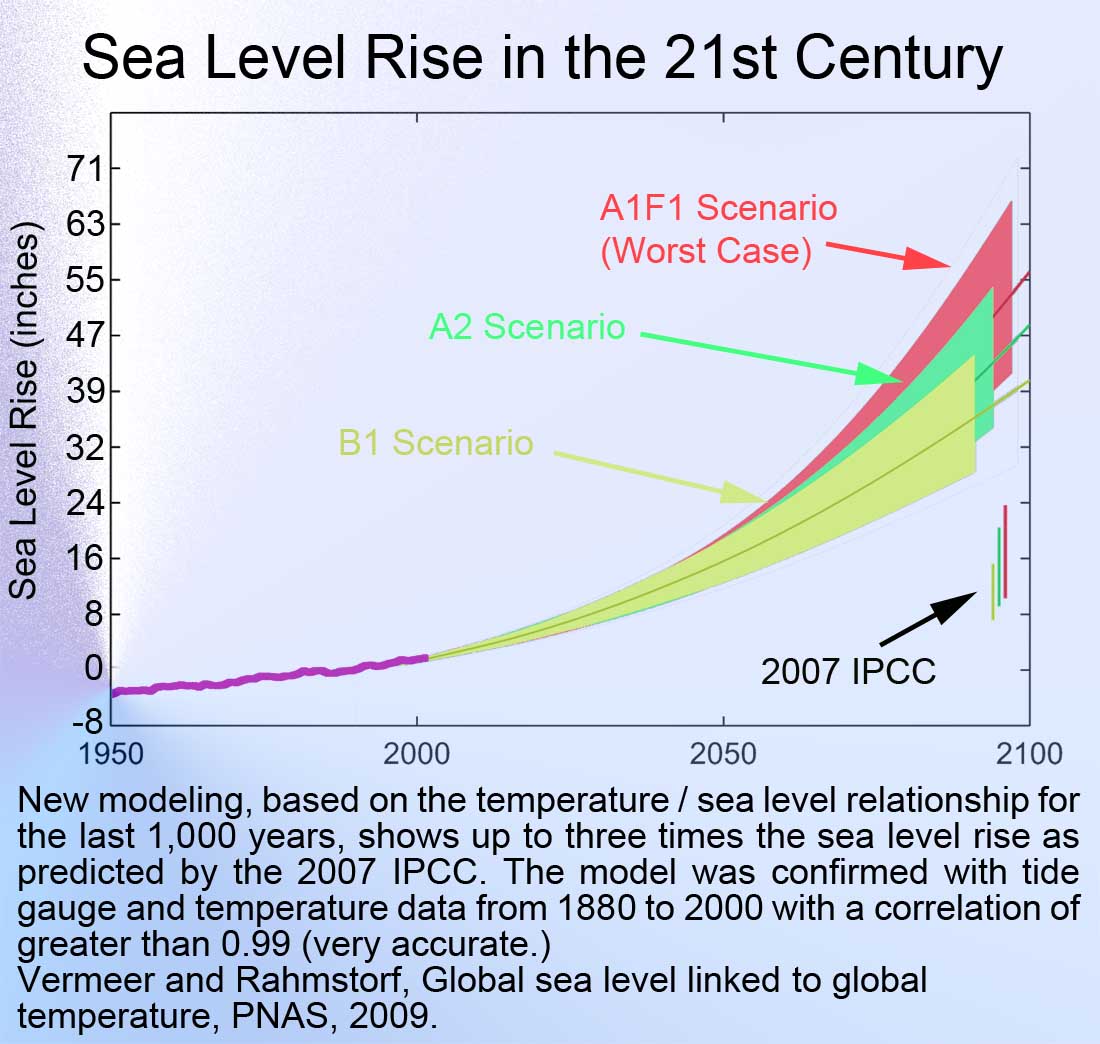
They also looked at a smaller piece of time than other sea level analyses that started, coincidentally, in 1930 at the beginning of a 40 year plateau in planetary warming. This choice of time frames, beginning at the beginning of this temporary temperature plateau, allowed sea rise acceleration to be masked.
The warming plateau was caused by massive industrialization during World War II. Air pollution cooled the planet and not until significant air pollution laws were passed in the 1970s did the air pollution begin to decline. This meant of course that the warming mask was lifted and the warming trend continued.
Houston and Dean's use of trend fitting technique was also inappropriate. They used a method that tried to fit a straight line onto the tide gauge data that is, as the climate scientists say "noisy." This data is inherently chaotic. Fitting a straight line trend to a chaotic data set is inherently troublesome.
The two Army Corp engineers also focus on projecting the 20th century trend into the 21st century. This is an intuitive error, and this is my own observation. As our climate warms more and more, there is more energy to melt more ice. This means more sea level rise. Evaluating 20th century data, when warming was less, and projecting that trend into the future, when warming is more, is an error in logic.
Also remember that we are only talking about tide gauge data. There are a
number of recent papers that say that sea level is
significantly accelerating based on gravitational measurements of ice lost
from ice sheets. Since just after the run of the century a new satellite
system called GRACE has been showing rapidly accelerating polar ice loss.
This latest generation of gravity measuring satellites is 100 times more
accurate than the previous technology.
Very few evaluations of the new GRACE data disagree with the consensus position and when they do, the disagreement is relatively small. For example, the vast majority of the findings show the West Antarctic ice sheet to be rapidly losing ice. The single dissenting view that I can speak to, says the loss is only half as large as the rest. Considering that as recently as the 2001 IPCC report, Antarctica was not supposed to be losing ice at all until 2100 (or later), makes the current losses, that are 90 or more years ahead of schedule, significant to say the least.
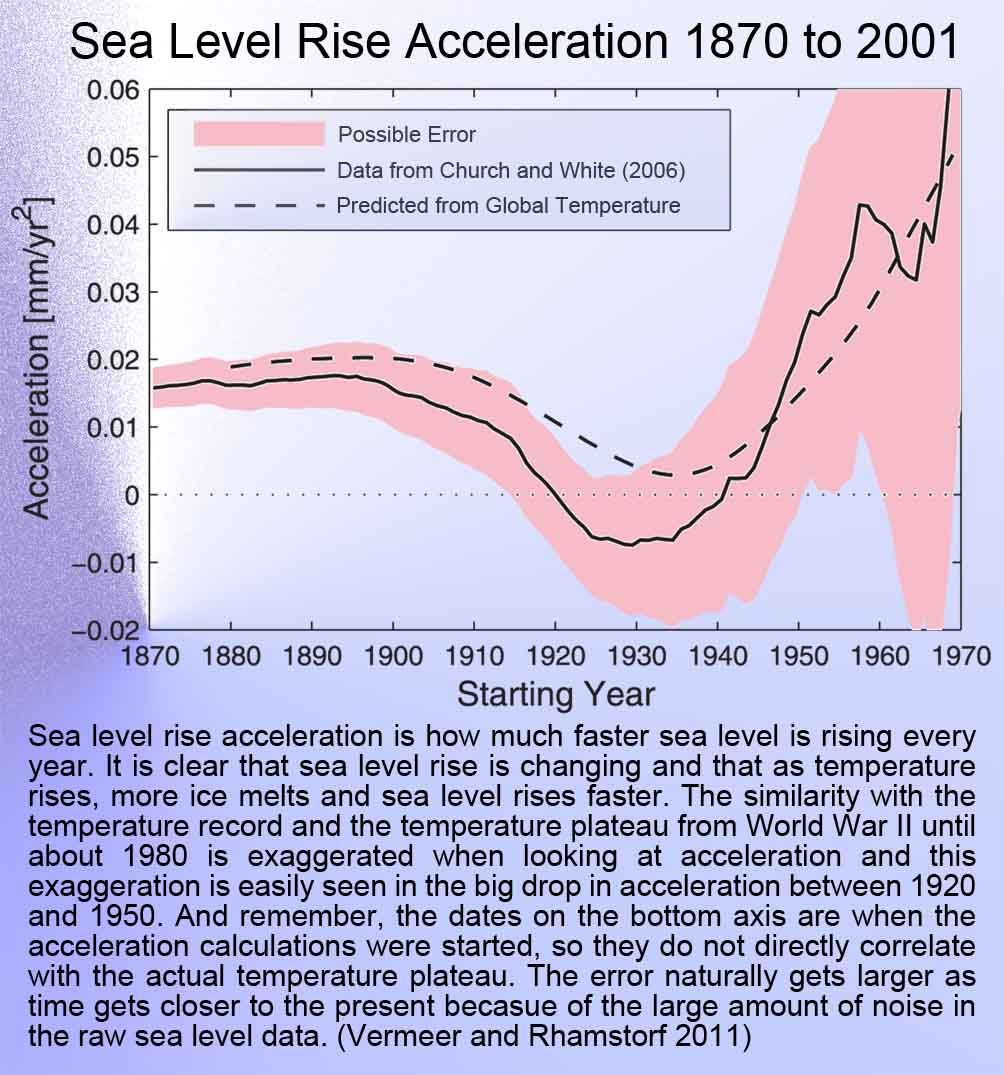
The latest in sea level rise evaluation is an analysis done by Vermeer and Rahmstorf in their rebuttal to Houston and Deans attempted destruction of Vermeer and Rhamstorfs fundamentally significant sea level rise temperature evaluation in 2009. It is clear that sea level is rising and that as temperature rises, more ice melts and sea level rises faster. The similarity with the temperature record and the temperature plateau from World War II until about 1980 is exaggerated when looking at acceleration and this exaggeration is easily seen in the big drop in acceleration between 1920 and 1950 in the graph titled Sea Level Rise Acceleration 1870 to 2001. And remember, the dates on the bottom axis are when the acceleration calculations were started, so they do not directly correlate with the actual temperature plateau. The error in this graph is shown in pink. Because of the statistical analysis, the error naturally gets larger as time gets closer to the present because of the large amount of noise in the raw sea level data. (Vermeer and Rhamstorf 2011)
Cazenova and Llovel (2009) say: "If, as is most likely, recent thermal expansion pause is temporary, and if land ice shrinking continues to accelerate, the prevailing sea level may be the source of some surprise in the near future."
Potsdam Institute for Climate Impact Research: http://www.pik-potsdam.de/sealevel/
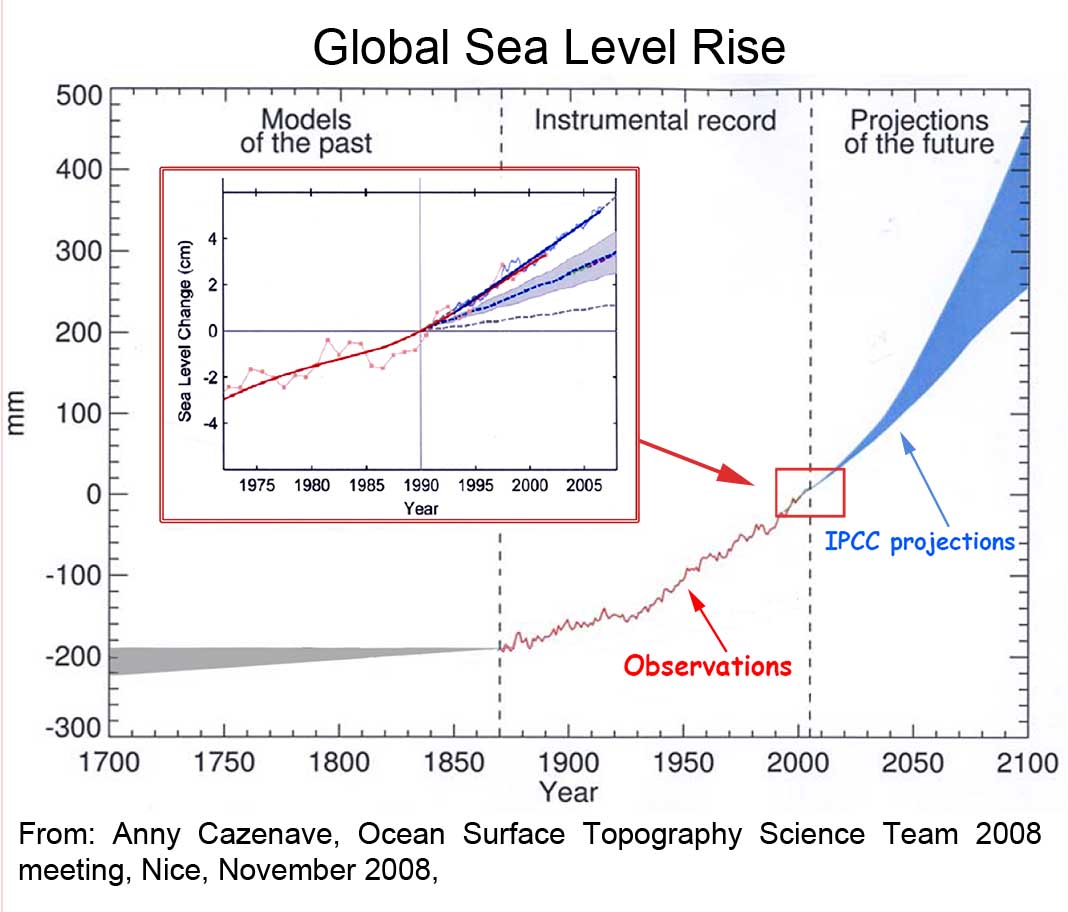
Anny Cazenave, Ocean Surface Topography Science Team 2008 meeting, Nice, November 2008.
Temperature and Sea Level Rise: This relationship is just about as solid as a physical relationship gets. It warms a little, ice melts a little, it warms a lot, ice melts a lot. What is not observed here however is what the ice scientists call dynamical ice sheet disintegration. it has been happening off and on in Antarctica for nearly twenty year and it has happened a few times in the Arctic too.
To question standard physics is absurd, Dean and Houston have track records of deniers. They assertion that sea level rise is not accelerating is also absurd, unless of course you would one of these folks who does not believe in Earth's temperature change evaluation.
There are those out there that make these assertions. I try and spend little time giving them credence by discussing their misguided beliefs. There is a very small amount of science that supports these misguided beliefs, but it is even smaller than these climate science deniers would have us believe. There is always a small amount of science that supports these skeptical beliefs, but scientifically moral and ethically appropriate professionals discount this small amount of information until it gains enough credibility toll show validity.
For over twenty years, this validity has not been forthcoming. The skeptical findings continue to perform their rightful role in fine tuning the main body of scientific work, but little has changed in the general direction of climate science. Carbon dioxide concentrations are increasing faster. The CO2 responsible can easily be shown to be fossil carbon, coming from fossil fuels. Earth's temperature is increasing, it is not decreasing, or even stable. The temperature graph may seem like temperatures have plateaued, but this is a short term phenomena not relative to climate timeframes, but to yearly weather trend chaos. The year 2011 was the warmest year ever recorded, warmer than 2005, then 1998 before that.
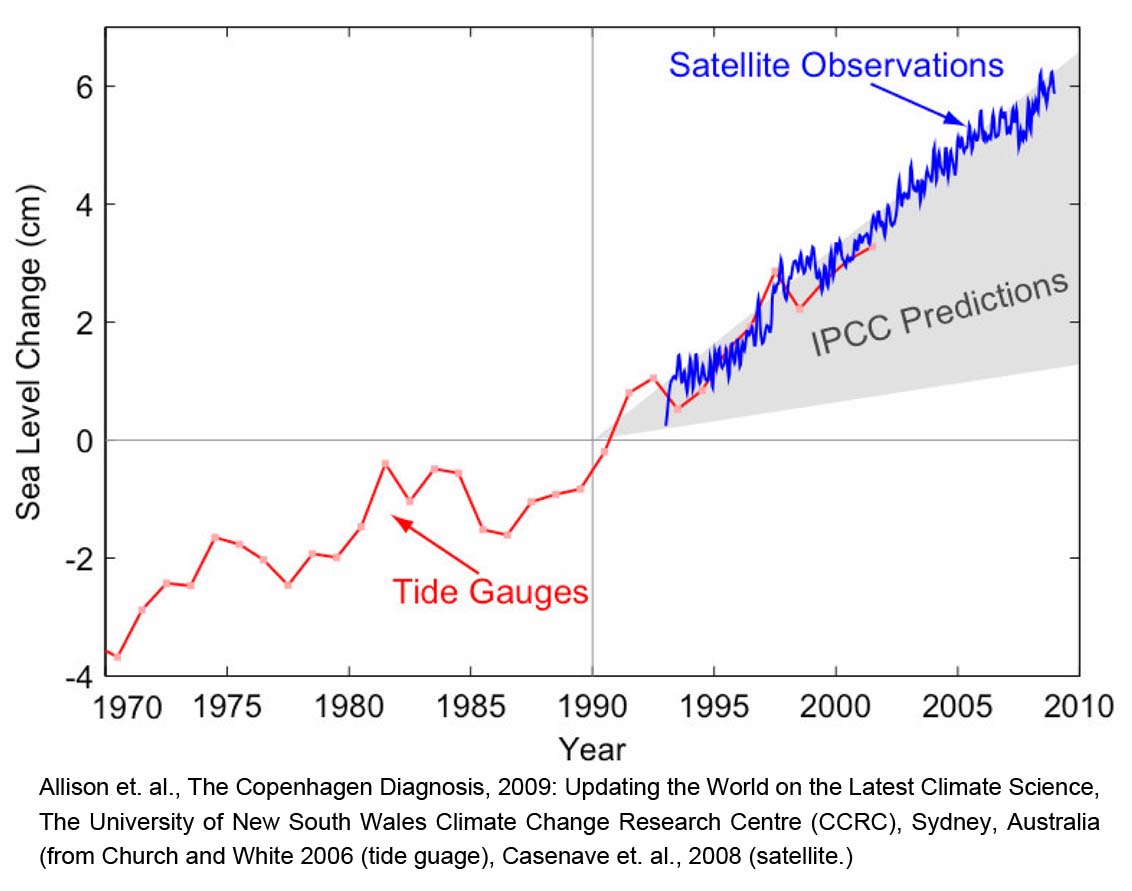 Our
climate is moving along the worst-case scenario, just like sea level rise
(Allison 2009.)
Impacts to global ecosystems are occurring, they are largely unprecedented
and they are occurring faster than they were supposed to. Climate Discovery
Chronicles brings this all to you when our media, owned by the great
Republican business community, continually clouds our understanding of the
facts with propaganda.
Our
climate is moving along the worst-case scenario, just like sea level rise
(Allison 2009.)
Impacts to global ecosystems are occurring, they are largely unprecedented
and they are occurring faster than they were supposed to. Climate Discovery
Chronicles brings this all to you when our media, owned by the great
Republican business community, continually clouds our understanding of the
facts with propaganda.
The Copenhagen Diagnosis, 2009: Updating the World on the Latest Climate Science. I. Allison, N.L. Bindoff, R.A. Bindschadler, P.M. Cox, N. de Noblet, M.H. England, J.E. Francis, N. Gruber, A.M. Haywood, D.J. Karoly, G. Kaser, C. Le Quéré, T.M. Lenton, M.E. Mann, B.I. McNeil, A.J. Pitman, S. Rahmstorf, E. Rignot, H.J. Schellnhuber, S.H. Schneider, S.C. Sherwood, R.C.J. Somerville, K. Steffen, E.J. Steig, M. Visbeck, A.J. Weaver. The University of New South Wales Climate Change Research Centre (CCRC), Sydney, Australia, 60pp.
http://www.copenhagendiagnosis.org/download/default.html
Vermeer and Rahmstorf, Global sea level linked to global temperature, PNAS, 2009.
http://www.pnas.org/content/106/51/21527.full.pdf+html
Rahmstorf and Vermeer, Discussion of Houston and Dean 2011. Sea level rise acceleration, Journal of Coastal Research, July 2011.
http://www.pik-potsdam.de/~stefan/Publications/Journals/rahmstorf_vermeer_2011.pdf
Grinsted et. al. (2009), Reconstructing sea level from paleo and projected temperatures 200 to 2100AD, Climate Dynamics, doi:10.1007/s00382-008-0507-2
http://www.glaciology.net/Home/PDFs/grinstedclimdyn09sealevel200to2100ad.pdf
Houston and Dean, Sea level acceleration based on U.S. tide gauges and extensions of previous global-gauge analyses, Journal of Climate Research, May 2011.
http://www.jcronline.org/doi/pdf/10.2112/JCOASTRES-D-10-00157.1
July 4, 2011 Permafrost Carbon Flux: Much More Dangerous Than it Sounds Permafrost in the Arctic is melting fast. This paper by scientists from the National Snow and Ice Data Center and NOAA published a paper in February has some wild news. Where was the media in February? You know the sensationalistic alarmist ones? Me thinks that Murdoch has been talking to them, he owns many of them you know. If he did not, they would have been on this story like a duck on a June bug. BTW, we had our first June bugs in March in Austin this year. Another sensational piece of news that the media missed.
The National Snow and Ice Data Center says that Arctic sea ice set a record low in July. The North Pole was 11 to 14 degrees warmer than normal, north of Russia it was 5 to 9 degrees warmer than normal. Only over the Kara Sea, a small area of the Arctic Ocean, between Novaya Zemlya and eastern Siberia the temp was 4 to 9 degrees below normal.
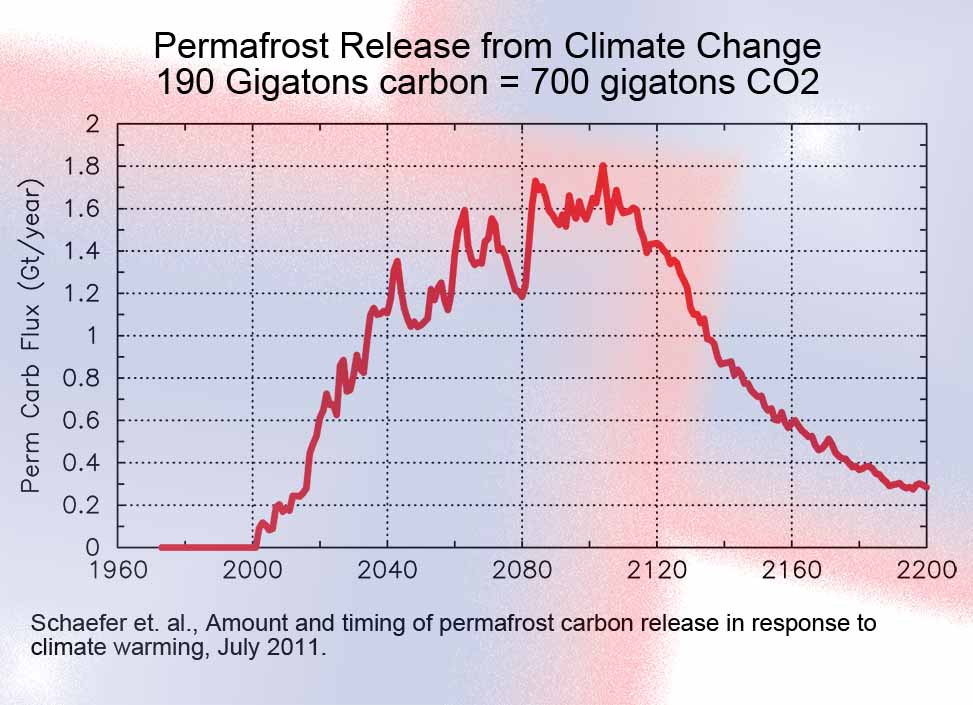
Dr. Schaefer and his colleagues have found that an astonishing amount of carbon will be released from permafrost in the next 190 years. “The amount of carbon released is equivalent to half the amount of carbon that has been released into the atmosphere since the dawn of the industrial age,” said NSIDC scientist Kevin Schaefer. “That is a lot of carbon.” The NSIDC press release says that between 29–59 percent of the permafrost will disappear by 2200. This permafrost took tens of thousands of years to form, but will melt in less than 200. The rate of greenhouse gas release right now is extremely fast as can be seen by the really steep part of the curve. The authors say that by 2020 the release will completely cancel out the Arctic carbon sink and half of the rest of the global land sink.
There is widespread permafrost degradation across the northern hemisphere with permafrost at depths up to 65 feet warming by 4 to 5 degrees F. This is a big deal.
 Now the bad news. These
scientists use the A1B scenario to evaluate this potential huge increase in
greenhouse gases. The A1B scenario of course is the middle of the road
scenario. We are currently on the path of the worst-case scenario of
greenhouse gas emissions. Dr. Schafer did tell me that for the Fifth IPCC
report, due out in 2013, they would be evaluating the worst-case scenario
for permafrost melt greenhouse gas release. And of course there is always
more bad news. Dr. Schaefer also said their analysis also assumed that most
of the greenhouse gases emitted by the melting permafrost would be carbon
dioxide when in reality half or more would most likely be methane.
Methane, for a long time, has been understood to warm 25 times more than
CO2, but the latest science says that methane has the potential to warm 32
times more than CO2.
Now the bad news. These
scientists use the A1B scenario to evaluate this potential huge increase in
greenhouse gases. The A1B scenario of course is the middle of the road
scenario. We are currently on the path of the worst-case scenario of
greenhouse gas emissions. Dr. Schafer did tell me that for the Fifth IPCC
report, due out in 2013, they would be evaluating the worst-case scenario
for permafrost melt greenhouse gas release. And of course there is always
more bad news. Dr. Schaefer also said their analysis also assumed that most
of the greenhouse gases emitted by the melting permafrost would be carbon
dioxide when in reality half or more would most likely be methane.
Methane, for a long time, has been understood to warm 25 times more than
CO2, but the latest science says that methane has the potential to warm 32
times more than CO2.
From NSIDC: "Permafrost covers 25 percent of the ground in the Northern Hemisphere, mostly above the Arctic Circle. Permafrost is ground that has stayed frozen for at least two years in a row, and often for many hundreds or even thousands of years. Harder to monitor than snow and ice on the surface, it also hides many secrets. The permafrost contains a large amount of vegetation, primarily partially decayed plant roots, that has remained frozen in a thick layer near the surface since the last ice age. Locked in this layer are some 1,672 gigatons of carbon from the decayed vegetation, more than twice the amount of carbon currently in the atmosphere. Like broccoli in the freezer, it is stable as long as it remains frozen, but when removed from the freezer, will quickly thaw and break down. Scientists have long been watching and measuring permafrost, which is difficult because of its extent and remoteness. Satellites do not easily detect frozen ground, so laborious field studies have been used to study and inventory permafrost. Scientists do not expect permafrost to thaw steadily, but instead to thaw and periodically refreeze, making it harder to plot out how it would release its carbon over time. Based on what they had learned about permafrost thawing, Schaefer and team were able to set up a computer model that combined temperature trends and other data to estimate how permafrost would thaw and release carbon in the future. The study concluded that one- to two-thirds of Earth's permafrost will disappear by the year 2200, releasing an amount of carbon equivalent to half the amount of carbon that has been released into the atmosphere since the dawn of the industrial age. Even at the lower end of the estimates, the amount of carbon released is expected to produce significant additional atmospheric warming. While not good news for the Earth, this knowledge helps more accurately gauge where global climate is headed." Schaefer, K., T. Zhang, L. Bruhwiler, A. P. Barrett. 2011. Amount and timing of permafrost carbon release in response to climate warming. Tellus, doi:10.1111/j.1600-0889.2011.00527.x
Schaefer et. al., Amount and timing of permafrost carbon release in response to climate warming, Tellus B, 63: 165–180. http://onlinelibrary.wiley.com/doi/10.1111/j.1600-0889.2011.00527.x/abstract
Press Release: http://nsidc.org/news/press/20110216_permafrost.html
Image courtesy Dr. Kevin Schaefer, National Snow and Ice Data Center
June 12, The Next Worst-Case Scenario: RCP 8.5 We have more acronyms for your increased state of general confusion. The AR5 is coming up (Assessment Report 5) to be relapsed by the IPCC in 2013 (Intergovernmental Panel on Climate Change.) This generation's report will look at newly created scenarios that more appropriately simulate atmospheric physics than the current scenarios. Scientists are leaving behind the somewhat policy based scenarios for the new batch that simply states trajectories and end, or the physical amount of greenhouse gases in our sky at a given point, rather than speculating on the 28 or so previous scenarios that looked at emissions and socioeconomic world evolution
This is good thing in that it allows for a better view of the science to be made. it is more simple and to the point. The CO2e level is easily measured and modeling related to the scenarios is more easily described than with the previous system.. These scenario families will no longer have the A1B, A1FI type of designations but will be more simple and more descriptive.
This new system is made up of RCP Scenarios (Representative Concentrations Pathways): RCP 2.6, RCP 4.5, RCP 6.0 and RCP 8.5. They are more descriptive in that for example, the RCP 4.5 scenario projects for 4.5 w/m2 (watts per square meter) radiative forcing in 2100. The scenario’s 4.5 W/m2 means roughly 525 parts per million carbon dioxide in the atmosphere (currently, CO2 concentrations are climbing through 390 parts per million). Most importantly, 525 ppm CO2 corresponds to about 650 ppm CO2e. the little "e" stands for equivalent, or the equivalent greenhouse gas forcing in CO2 equivalents when all greenhouse gases are taken into consideration. CO2e includes, methane, ozone, and the myriad other greenhouse gases emitted by man.
RCP 2.6 2.6 w/m2 500 ppm CO2e The best case scenario: CO2e rises to 500 ppm before leveling off at 450 ppm Compares to the B1 Scenario CO2e of 640 ppm
RCP 4.5 4.5 w/ms CO2e rises to 525
RCP 6.0
RCP 8.5 8.5 w/m2 1464 CO2e Compares to A1FI Scenario at 1360 CO2e
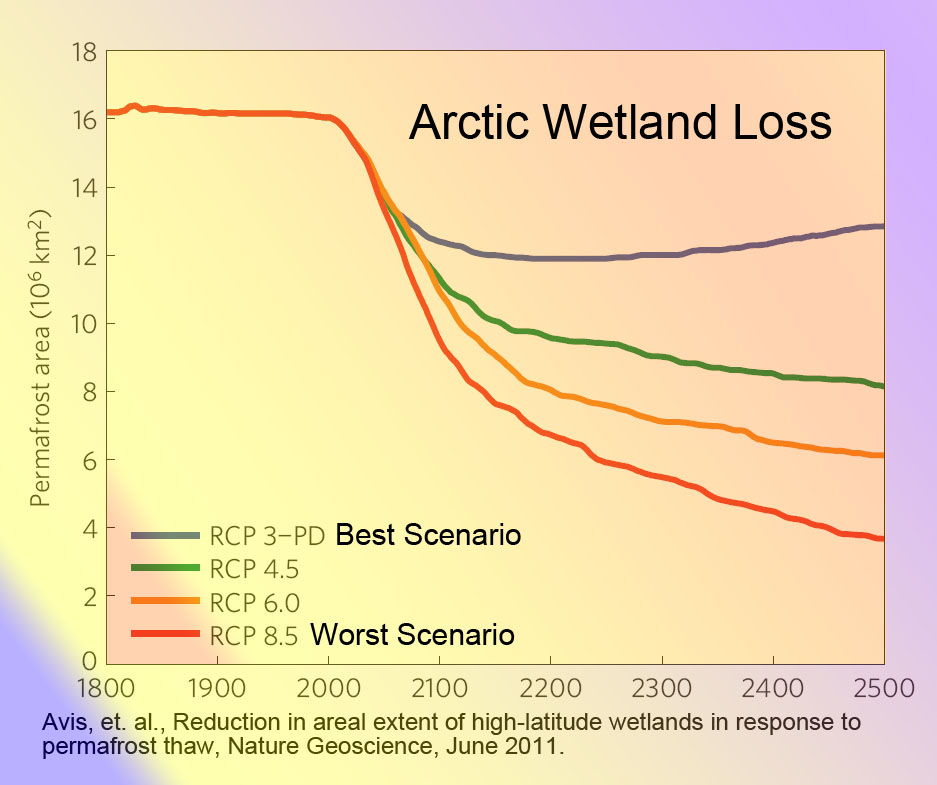
June 10, 2011 Reduction In Areal Extent Of High-latitude Wetlands In
Response To Permafrost Thaw New modeling of
permafrost
shows that the worst-case scenario will see almost as many greenhouse gases
emitted because of melting permafrost than man has emitted since the
beginning of time. The time frame for these emissions is two centuries (190
years.) In addition, wetlands area of the far north will decrease by 75%.
One of the biggest issues
 with permafrost melt is the overall climate in the
Arctic. Permafrost is on average 70 percent water and 30 percent frozen
partially decomposed organic material when it thaws, all of the partially
decomposed organic material decomposes all at once. the result is that all
of that carbon, stored for thousands and even tens of thousands of years, is
all released virtually as it melts. Some of the organic material decomposes
into carbon dioxide, but much of it will decompose under water and release
methane instead. Methane is a far more powerful greenhouse gas than carbon
dioxide which will create far more warming than carbon dioxide.
with permafrost melt is the overall climate in the
Arctic. Permafrost is on average 70 percent water and 30 percent frozen
partially decomposed organic material when it thaws, all of the partially
decomposed organic material decomposes all at once. the result is that all
of that carbon, stored for thousands and even tens of thousands of years, is
all released virtually as it melts. Some of the organic material decomposes
into carbon dioxide, but much of it will decompose under water and release
methane instead. Methane is a far more powerful greenhouse gas than carbon
dioxide which will create far more warming than carbon dioxide.
After the thaw and greenhouse gas release the permafrost melt lakes slowly dry up, or relatively quickly in time frames related to us humans. The climate is warmer, and not as hostile to plants that grow more than a few inches above ground, so shrubs and trees start to grow. Because this vegetation is taller than tundra, it sticks up above the snow and absorbs up to nine times more of the suns heat as does snow covered tundra. This is called a vegetation feedback and it warms the local climate more. A warmer local climate, over land, warms the ocean, adjacent to land. This melts more sea ice. With less sea ice there is more open water because the ice starts freezing later in the fall and melts earlier in the spring. this means the Arctic ocean can absorb more heat and the sea ice spiral decline continues.
Globally, a warmer Arctic means changes to the jet stream. It means Arctic storms have more moisture because they are warmer and they contain more moisture because the Arctic Ocean has less sea ice allowing more water evaporation. The jet stream pushed the warmer arctic storms further south (they are still really cold, just not as cold as before) and the bigger storms moving further south have bigger affects across larger stretches of the middle latitudes.
These feedbacks continue to increase until it is so warm that sea ice does not form at all. The challenge is determining when this point is reached. Right now, the IPCC says this will not be a problem in the 21st century, but some scientists are starting to challenge this assertion. This has happened before, 20 or 40 million years ago, but Earth was an entirely different place then. The continents were aligned more along the equator ocean currents were vastly different. The models say that today, without the great freezer around the north pole, temperatures would be higher than anything every experienced in the history of Earth, since green plants were on land allowing more of the sun's energy to be absorbed and stay on the planet. To have this kind of thing happen when our continents are grouped more towards the north pole is completely unprecedented in the history of Earth, when there were green plants on land.
Avis, et. al., Reduction in areal extent of high-latitude wetlands in response to permafrost thaw Nature Geoscience. doi:10.1038/ngeo1160 http://dx.doi.org/10.1038/ngeo1160
Press release: http://nsidc.org/monthlyhighlights/february2011.html http://www.nature.com/ngeo/journal/v4/n7/abs/ngeo1160.html
June 8, 2011 Siberian Permafrost Venting could Trigger Abrupt Climate Warming Warns National Science Foundation: Climate Progress quote: "NSF issues world a wake-up call: “Release of even a fraction of the methane stored in the shelf could trigger abrupt climate warming.”
Science 5 March 2010: Vol. 327 no. 5970 pp. 1246-1250 DOI: 10.1126/science.1182221 Report Extensive Methane Venting to the Atmosphere from Sediments of the East Siberian Arctic Shelf
http://www.sciencemag.org/content/327/5970/1246.abstract
Climate Action: http://thinkprogress.org/romm/2010/03/04/205600/science-nsf-tundra-permafrost-methane-east-siberian-arctic-shelf-venting/
June 7, 2011 Current Climate Change is 10 Times Faster than the PETM 55 Million Years Ago The big deal here is that the PETM (Pleistocene Eocene Thermal Maximum) was a massive ocean extinction event. There was a minor extinction event on land, but the big deal happened in the world's oceans. The global temperature change was only about five degrees and it was short lived (20,000 years.)
What likely happened was, as the world warmed to the Eocene Climate Optimum,
frozen methane
 clathrates on the ocean floor destabilized. Massive amounts
of methane thawed, much of it dissolving into the ocean and creating highly
acidic conditions. This caused the great ocean extinction event. some
of it made it into the atmosphere causing the warming and associated land
extinction.
clathrates on the ocean floor destabilized. Massive amounts
of methane thawed, much of it dissolving into the ocean and creating highly
acidic conditions. This caused the great ocean extinction event. some
of it made it into the atmosphere causing the warming and associated land
extinction.
This theory is known as the Clathrate Gun Theory. Methane is a peculiar substance, it warms the atmosphere about 35 times more than carbon dioxide. The numbers have changed recently, because of warming already encountered, methane has the capacity warm more. It used to be that methane only had the capacity to warm 25 times more than carbon dioxide. Part of this theory, that goes along with many other extinction theories, is that the clathrate gun has played a big role in extinctions many times in the past.
How all of that methane gets there involves what is called marine snow. The oceans are full of life, most of which is in the form of very small or microscopic algae and plankton. As these life forms die, their bodies float to the ocean floor, often clumping together during the long fall and creating what looks like snow in the ocean abyss. This "snow", made up of organic material then decomposes. Sa it decomposes it releases methane. Because the pressure is so great on the ocean floor, the methane combines with water and can actually freeze at temperatures above the freezing point of water.
This frozen methane collects in the decomposing sediments until the pressure rises because of falling sea level, or the ocean temperature rises. The frozen methane is already in a delicate, fairly unstable state, so it is relatively easy to melt, relatively being the operative term. This "easy" melt has not happened in a long long time, since the PETM, 55.9 million years ago
This paper from Penn State, University of Bristol, University of Southampton, University of Cincinatti and Princeton finds that the rate of carbon dioxide emissions during the PETM was only about as much as the U.S. or China emits every year yet, it created a massive ocean extinction event. In other words, mankind is emitting greenhouse gases ten times faster, today than during the PETM extinction event when about half of all species in our oceans went extinct. So the "gun" is much more likely to "go off" in our global warming future than in a long, long time.
The National Science Foundation, Worldwide Universities Network and Penn State supported this work.
Cui et. al., Slow release of fossil carbon during the Paleocene–Eocene Thermal Maximum. Nature Geoscience, 2011; DOI: 10.1038/ngeo1179
Penn State Press Release: http://live.psu.edu/story/53683
Zachos 2001 et. al., Trends, rhythms, and aberrations in global climate 65 Ma to Present, Science, April 27, 2001.
Harding et. al., Sea-level and salinity fluctuations during the Paleocene–Eocene thermal maximum in Arctic Spitsbergen. Earth Planet. Sci. Lett. (2011).doi:10.1016/j.epsl.2010.12.043 http://people.rses.anu.edu.au/roberts_a/AR_Publications/130_Harding_et_al_2011.pdf
National Oceanography Center Press Release: http://noc.ac.uk/news/arctic-environment-during-ancient-bout-natural-global-warming
May 24, 2011 1,000-year Storm on the Mackenzie Delta, Arctic Ocean
- The Queens University press release announces that they and Carleton
Universities have completed research that has, as the press release states
"...uncovered startling new evidence of the destructive impact of global
climate change on North America’s largest Arctic delta." The study looked at
a storm surge during the summer of 1999 that created a widespread die-off of
nearly all vegetation in a large area of the Mackenzie Delta in far northern
Canada on the shores of the Arctic Ocean.
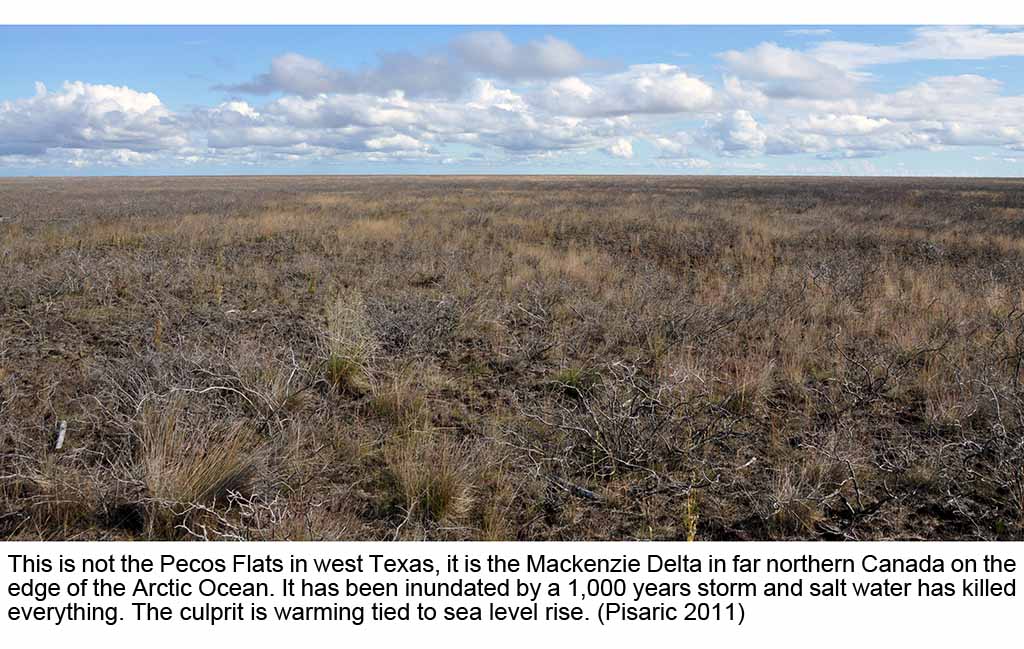
The scientists involved in the study looked at growth rings from the dwarf arctic alders (shrubs) and sediments from the prolific ponds that dot the Mackenzie Delta wetlands. The storm surge killed about half of the shrubs outright and an additional 37 percent were died over the next four years. A decade later, soils in the affected delta area were still so impregnated with salt that recovery was still not taking place.
But dwarf arctic shrubs can only be dated back about 80 years. The remainder of the study looked at the sediments in those abundant arctic wetland pools. These sediment layers in these permanent pools can be analyzed for a thousand years back into the past. How this is done is through looking at the microscopic skeletons of single and multi-celled diatoms that lived in eh pools. There are distinct differences between salt water species and freshwater species (of diatoms.) The 1999 storm surge marked a distinct delineation of sediments with only fresh water diatoms to pools populated only with only salt water species. This means that clearly this event was unprecedented in 1,000 years.
from Science Daily "By studying growth rings from coastal shrubs and lake sediments in the Mackenzie Delta region of the Northwest Territories -- the scene of a widespread and ecologically destructive storm surge in 1999 -- the researchers have discovered that the impact of these salt-water surges is unprecedented in the 1,000-year history of the lake."
University of Queen's biology professor and team
member John Smol
"Our findings show this is ecologically
unprecedented over the last millennium."
Team co-leader Michael Pisaric said
"This had been predicted by all the models and
now we have empirical evidence." The most striking bit of
discussion though comes from the abstract to the paper published in the
Proceedings of the National Academy of Sciences: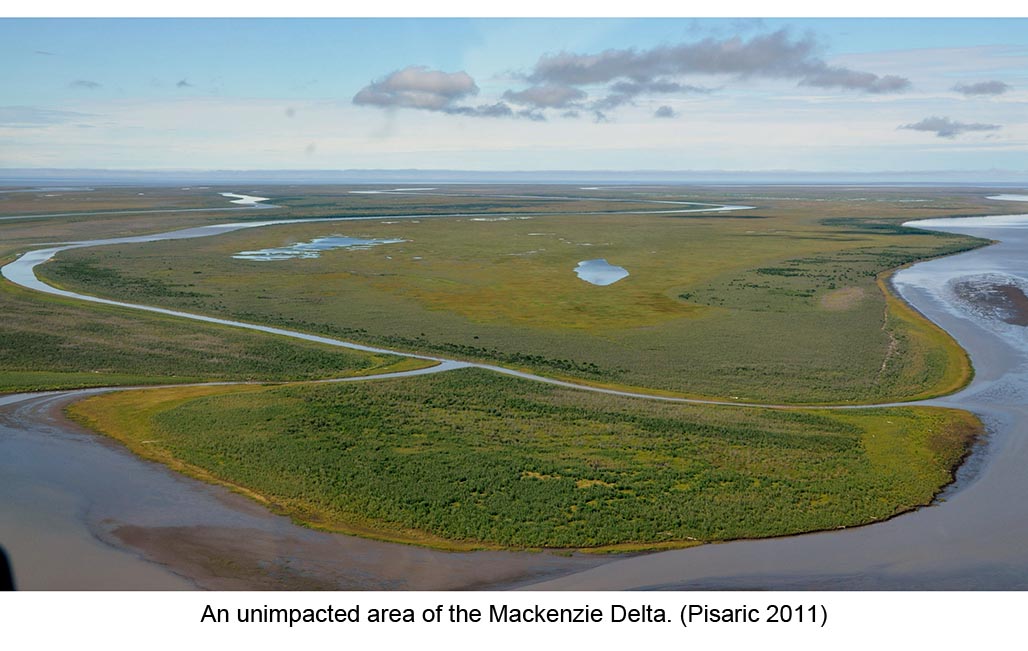
"One of the most ominous predictions related to recent climatic warming is that low-lying coastal environments will be inundated by higher sea levels. The threat is especially acute in polar regions because reductions in extent and duration of sea ice cover increase the risk of storm surge occurrence. [Sea ice eliminates wind driven waves that are a large part of storm surge impacts.] The Mackenzie Delta of northwest Canada is an ecologically significant ecosystem adapted to freshwater flooding during spring breakup. Marine storm surges during the open-water season, which move saltwater into the delta, can have major impacts on terrestrial and aquatic systems. We examined growth rings of alder shrubs (Alnus viridis subsp. fruticosa) and diatoms preserved in dated lake sediment cores to show that a recent marine storm surge in 1999 caused widespread ecological changes across a broad extent of the outer Mackenzie Delta. For example, diatom assemblages record a striking shift from freshwater to brackish species following the inundation event. What is of particular significance is that the magnitude of this recent ecological impact is unmatched over the [greater than] 1,000-year history of this lake ecosystem. We infer that no biological recovery has occurred in this lake, while large areas of terrestrial vegetation remain dramatically altered over a decade later, suggesting that these systems may be on a new ecological trajectory. As climate continues to warm and sea ice declines, similar changes will likely be repeated in other coastal areas of the circumpolar Arctic. Given the magnitude of ecological changes recorded in this study, such impacts may prove to be long lasting or possibly irreversible."
The PNAS paper concludes "As the Arctic warms, sea levels rise, ice cover declines, and the length of the open water season increases, the likelihood and potential impacts of storm surges will be exacerbated in low-lying Arctic coastal environments (3). These changes will impact not only the ecological integrity of Arctic coastal systems, but also the infrastructure and economies of many Arctic coastal communities." and the press release concludes “The Arctic is on the front line of climate change. It’s a bellwether of things to come: what affects the Arctic eventually will affect us all.”
Pisaric et. al., Impacts of a recent storm surge on an Arctic delta ecosystem examined in the context to the last millennium, PNAS, May 2011. http://www.pnas.org/content/108/22/8960
Queens's University Press Release: http://www.queensu.ca/news/articles/striking-ecological-impact-canada-s-arctic-coastline-linked-global-climate-change
Queens University website showcasing this research: http://post.queensu.ca/~pearl/Dead%20Zone%20project/Storm%20surge%20impacts.html
May 23, 2011 Oxygen Depletion Extinction Events During Greenhouse Oceans - From Science Daily: "What's alarming to us as scientists is that there were only very slight natural changes that resulted in the onset of hypoxia in the deep ocean," said Professor Kennedy. "This occurred relatively rapidly -- in periods of hundreds of years, or possibly even less -- not gradually over longer, geological time scales, suggesting that Earth's oceans are in a much more delicate balance during greenhouse conditions than originally thought, and may respond in a more abrupt fashion to even subtle changes in temperature and CO2 levels."
Science Daily: http://www.sciencedaily.com/releases/2011/05/110517105812.htm
http://www.pnas.org/content/108/24/9776.full.pdf
M. J. Kennedy, T. Wagner. Clay mineral continental amplifier for marine carbon sequestration in a greenhouse ocean. Proceedings of the National Academy of Sciences, 2011; DOI: 10.1073/pnas.1018670108
May 22, 2011, Joplin Tornado ...
May 22, 2011 Climate Catastrophes Mount - They've been telling us for decades, that we must change our path. The chairman and CEO of Allstate Insurance says that we have seen a dramatic increase in the amount of hailstorms, golf balls, football-sized hail (he said it not me), straight-line winds to 80 miles an hour, 120 tornadoes ... you see a lot more severe weather," in a conference call to Wall Street analysts.
The number of natural disasters in 2010 set a new record at 247, according to the Insurance Information Institute. This broke the previous record of 200 events set just one year before, in 2009. Each of the last three years saw $13 billion in damage, $10 billion of which was damaged. This is higher than the costs of most hurricanes and 80 approaches the $18 billion cost of the 9/11 attack.
2011 is already threatening to eclipse with $9.5 billion already racked up on the April tornadoes across the south. The Allstate Chairman said that some people think that this is a cycle and that these catastrophes will pass as another natural cycle, but the climate scientists have been assuring us that this is not the case, so Allstate is viewing this as a permanent change.
From the LA Times, May 20, http://www.nytimes.com/cwire/2011/05/20/20climatewire-inland-storms-growing-in-violence-drive-insu-96465.html?pagewanted=2&ref=earth
May 21, 2011 Departures from eustasy in Pliocene sea-level records
Nature Geoscience 4, 328–332 (2011) doi:10.1038/ngeo1118
Received
18 October 2010
Accepted
22 February 2011
Published online
17 April 2011
Proxy data suggest that atmospheric CO2 levels during the middle of the Pliocene epoch (about 3 My ago) were
similar to today, leading to the use of this interval as a potential analogue for future climate change.
estimates for mid-Pliocene sea levels range from 10 to 40 m above present, and a value of +25 m is often
adopted in numerical climate model simulations. A eustatic change of such magnitude implies the complete
glaciations of the West Antarctic and Greenland ice sheets, and significant loss of mass in the East Antarctic
ice sheet. However, the effects of glacial isostatic adjustments have not been accounted for in Pliocene sea-level
reconstructions. Here we numerically model these effects on Pliocene shoreline features using a gravitationally
self-consistent treatment of post-glacial sea-level change. We find that the predicted modern elevation of
Pliocene shoreline features can deviate significantly from the eustatic signal, even in the absence of
subsequent tectonically-driven movements of the Earth’s surface. In our simulations, this non-eustatic
sea-level change, at individual locations, is caused primarily by residual isostatic adjustments associated
with late Pleistocene glaciation. We conclude that a combination of model results and field observations
can help to better constrain sea level in the past, and hence lend insight into the stability of ice sheets
under varying climate conditions.
http://www.nature.com/ngeo/journal/v4/n5/full/ngeo1118.html

May 12, 2011 Extreme Weather Across the U.S. Increases Because of
Climate Change ... A phone conference and press release about
climate change induced extreme weather, by the Union of Concerned Scientists,
brings to light what climate scientists have been telling us for decades.
The Union of Concerned Scientists (UCS) is the leading U.S. science-based
nonprofit organization working for a healthy environment and a safer world.
Founded in 1969, UCS is headquartered in Cambridge, Massachusetts, and also
has offices in Berkeley, Chicago and Washington, D.C.
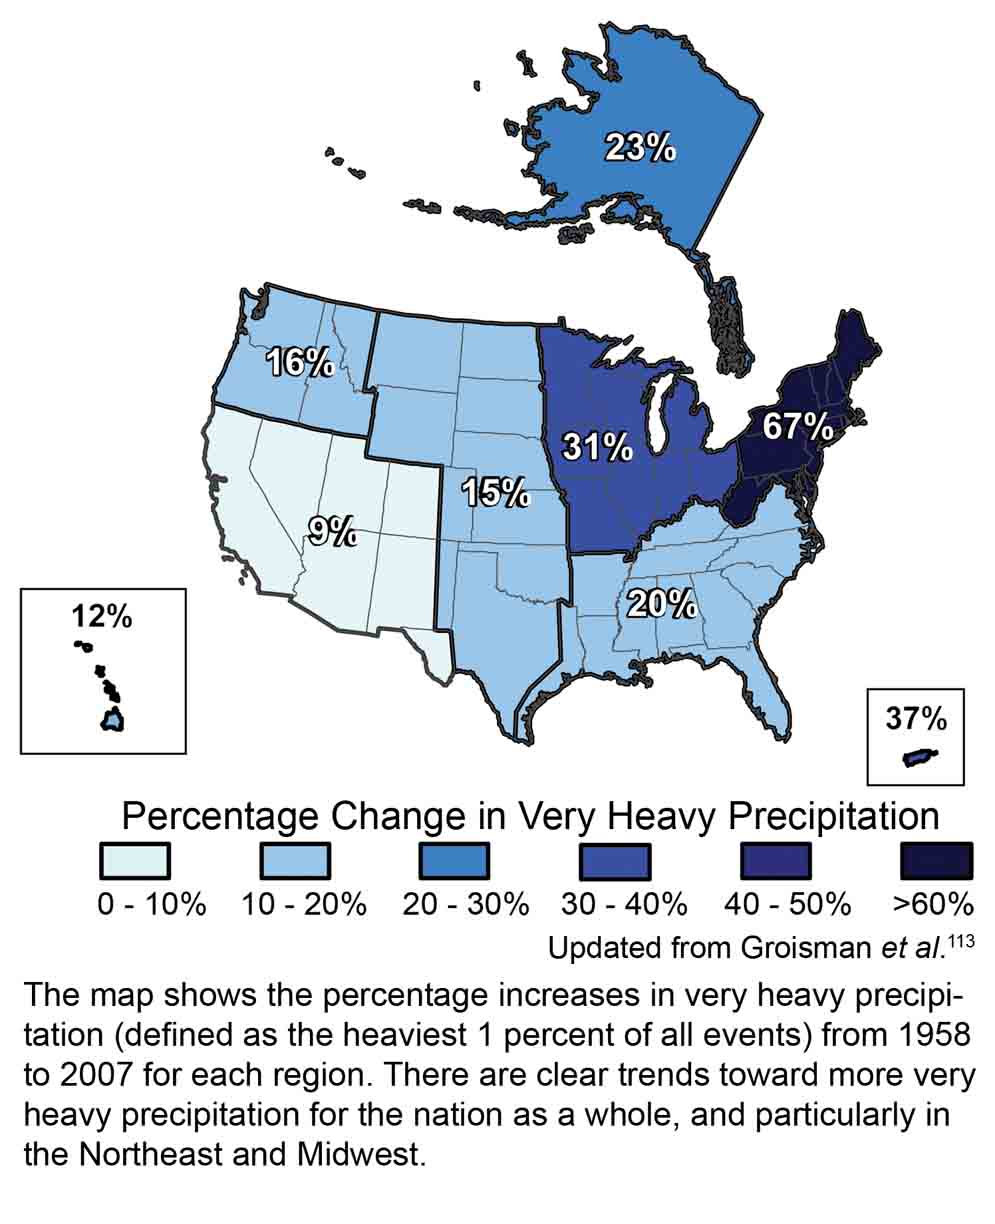
The UCS says that the amount of rain or snow falling in the heaviest one percent of storm has increased 20 percent in the last several years across the U.S. this is almost three times the rate of increase between 1958 and 2007, signaling what may have been a threshold crossing. The Northeastern U.S. has seen a 67 percent increase in the amount of rain and snow falling in the heaviest storms. The land area classified as very dry with a Palmer Drought Severity Index (PDSI) of -3 or more extreme has more than doubled since the 1970s. A PDSI of -3 to -3.99 is a sever drought, -4 and less is an extreme drought and the bottom of the chart.
Dr. Kevin Trenberth from the National Center for Atmospheric Research, sponsored by the National Science Foundation, in his paper "Changes in precipitation with climate change" reminds us that drier areas will get drier and wetter areas will get wetter, for the most part. Rain will come faster in greater quantities, but will occur less frequently. More intense but less frequent rains lead to more runoff per storm with less water soaking in to the ground which because the storms of less frequent, leads to more drought.
He also tells us that air holds 4% more moisture per degree Fahrenheit of warming, (7% per degree C) which might not sound like a lot, but it really adds up. More moisture in air releases more heat as it condenses, rising into a cloud, this extra heat creates more lift which draws in yet more air. It is the primary mechanism that creates a more intense thunderstorm than would otherwise have been created. It is also a feedback mechanism that feeds upon itself. A little bit more moisture creates a little ore updraft which brings in a little more moisture which creates even more updraft, shazaam - severe thunderstorm.
A thunderstorms increase in precipitation is based on this ability to pull in moisture from large surrounding areas. This area has been demonstrated to be ten to twenty five times larger than the size of the rain area. So the 4% increase in moisture in the air per degree F.
Trenberth warns us that nearly all climate models misrepresent rainfall because f climate change. The almost all allow rainfall to begin too soon, and do not create enough rain with any individual rainfall event. This of course negatively impacts the hydrologic cycle because heavier rains mean more runoff and more frequent drought because less rain soaks in the ground.
Floods on the Mississippi? Across the Nation, April 2011 was the tenth wettest on record, but here in my hometown of Austin, April was the driest April on record. We are in the midst of our third extreme to exceptional drought here in the last seven years. The drought is so extreme here that the inflows to our local reservoirs have , twice in the last three years, fallen to levels that are lower than the drought of record here, which is the drought of the 1950s. Inflows to our reservoirs have not been as low as the were in the 1950s at any other time.
Trenberth, National Center for Atmospheric Research, Changes in precipitation with climate change, Climate Research, vol 25, 2011. http://www.cgd.ucar.edu/cas/Trenberth/trenberth.papers/SSD%20Trenberth%202nd%20proof.pdf http://www.int-res.com/articles/cr_oa/c047p123.pdf
US Global Change Research Program, Global Climate change Impacts in the United States, 2009. http://www.globalchange.gov/publications/reports/scientific-assessments/us-impacts/full-report/national-climate-change
May 8, 2011 Climate Changes in the Arctic More Extensive Than Expected
Lund University UK, Press Release http://www.lunduniversity.lu.se/o.o.i.s?news_item=5580&id=24890
May 7, 2011 Amazon Drought of 2010 was Four Times More Extreme than the 100-Year Drought in 2005 Abstract: "During this decade, the Amazon region has suffered two severe droughts in the short span of five years – 2005 and 2010. Studies on the 2005 drought present a complex, and sometimes contradictory, picture of how these forests have responded to the drought. Now, on the heels of the 2005 drought, comes an even stronger drought in 2010, as indicated by record low river levels in the 109 years of bookkeeping. How has the vegetation in this region responded to this record‐breaking drought? Here we report widespread, severe and persistent declines in vegetation greenness, a proxy for photosynthetic carbon fixation, in the Amazon region during the 2010 drought based on analysis of satellite measurements. The 2010 drought, as measured by rainfall deficit, affected an area 1.65 times larger than the 2005 drought – nearly 5 million km2 of vegetated area in Amazonia. The decline in greenness during the 2010 drought spanned an area that was four times greater (2.4 million km2) and more severe than in 2005. Notably, 51% of all drought‐stricken forests showed greenness declines in 2010 (1.68 million km2) compared to only 14% in 2005 (0.32 million km2). These declines in 2010 persisted following the end of the dry season drought and return of rainfall to normal levels, unlike in 2005. Overall, the widespread loss of photosynthetic capacity of Amazonian vegetation due to the 2010 drought may represent a significant perturbation to the global carbon cycle."
Xu, et. al., Widespread decline in greenness of Amazonian vegetation due to the 2010 drought, Geophysical Research Letters, April 8, 2011. http://www.agu.org/journals/gl/gl1107/2011GL046824/
May 4, 2011 Global Deforestation from Insects, Disease, Wildfire, Drought Kill - Dwarf Emissions from Third World Agriculture Deforestation The World Wildlife Fund says that we could lose 57 billion acres of forest to development and agriculture by 2050. There is NO mention of loss of forests due to climate change in their new report. Even though, 64 million acres are dead from a climate change induced insect attack in the North American Rockies.
Alaskan Boreal forests have already switched from a carbon sink to a carbon source because of fire. The fire is burning the drought dried soils causing an annual carbon emissions of 14.1 megatons. This is expected to increase 200% to 300% by 2050 to 2100, but scientist say that if warming continues to melt permafrost, this amount will increase dramatically as drained permafrost areas burn which in turn, will accelerate more permafrost melt in a positive feedback that the authors say has significant implications for greenhouse gas emissions in northern regions. (see here)
The North American pine beetle pandemic is still out of control. Canadian foresters calculated that just the dead trees in British Columbia would emit nearly 16 megatons of carbon per year for twenty years. If it is too warm for these forests to regenerate after twenty years, all bets are off on these forests ever absorbing Carbon dioxide again (in time frames that matter, like centuries.)
Annual C emissions from deforestation are about 1.4 gigatons, so if the Alaskan forests double or triple or worse, and we consider that the Alaskan Boreal is less than a tenth of global boreal forests and the same thing is going on around the globe, we get 300 or 400 megatons of C emitted. The pine beetle pandemic has likely doubled it's emissions and it will keep on doubling for decades to come, so add another 100 or 200 megatons. The total is more than a third of emissions from global deforestation.
Unless one includes what could be the biggest climate change impact yet. it dwarfs global emissions from deforestation. The Amazon has flipped form sink to source. Every year for the next decade or so, the Amazon will emit 3.5 gigatons of carbon, nearly triple the emissions from deforestation. This flip has been caused by two 100-year droughts in 2005 and 2010. The author of the paper documenting this discovery says that if we have another of these droughts in the next ten years, and the predictions seem to indicate this is more likely than not, the Amazon may never return to a carbon sink again.
So why is this news not in the WWF report? What does the worlds environmental organizations continue to ignore the ongoing climate impacts that literally dwarf the impacts and environmental issues of the 20th century? This is 1998 no longer. Please pay attention. it no longer matters how bad deforestation is in Rawanda. Climate change impacts that were reserved for the distant future are happening now, right under our favorite environmental organizations collective noses. Please. Get an eff-ing grip.
World Wildlife Fund: Reducing Emissions from Deforestation (link)
World Wildlife Fund: Zero Net Deforestation (link)
April 30, 2010 All weather today is Caused by Climate Change Because, Our Climate has Changed as per One of the Most Important Climate Scientists in the World More and more scientists are finally making the realization that this common excuse for the wicked climate change induced extremes of weather we have been having are actual ALL being caused by climate change. Today in real climate science land, "we can not tell if any one individual weather event is caused by climate change" is quickly becoming an unacceptable thing to say. Dr. Kevin Trenberth, Head of the Climate Analysis Section at the National Center for Atmospheric Research and Noble Laureate with 423 publications has this to say on the topic:
"Given that global warming is unequivocal, the null hypothesis should be that all weather events are affected by global warming rather than the inane statements along the lines of "of course we cannot attribute any particular weather event to global warming". That kind of comment is answering the wrong question."
What does null hypothesis mean? The "null hypothesis" is simple the opposite of the hypothesis. In this case, the assumption (the hypothesis) is that one cannot tell if any given weather event is caused by climate change or not. the Null hypothesis would then be the opposite of this statement - All weather events are now caused by climate change.
Link - http://ams.confex.com/ams/91Annual/webprogram/Paper180230.html
April 29, 2011 Tornado Outbreak Equal to 5,000 Dead in 1925
(Normalized), Climate Change has Increased Weather Extremes: More than 360 have been killed, approaching the 454 killed in the worst
single April tornado outbreak ever in Gainesville - Tupelo in 1936.
Just one day after the outbreak, the number of casualties is still adding
up. Let's put this into perspective. In 1936, the U.S. population was about
128 million. Today it has almost tripled to 308 million. Supposing that the
population density has remained the same (it has not, many more people live
in the cities now than they did in the '30s) we should expect triple the
casualties (about 1,000).
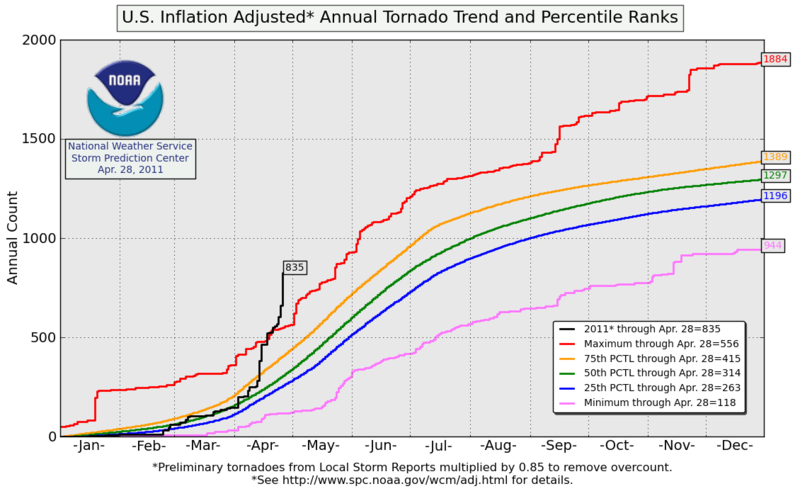
But there's more: Building codes today are much more strict than they were in the '30s, meaning there are fewer casualties today than in the past, but early warning is possibly the greatest improvement in life saving techniques today. In the 30's, tornado warning systems had not even been invented yet. Today we have dopler radar, instant weather warning radios, civil defense systems that warn entire communities with sirens and virtually instant communications with television, radio and the internet. The first official tornado warning was made in 1948. The first method of broadcasting emergencies, intended to alert the public of a Soviet attack during the cold war (and tornadoes), was started in 1951. The Emergency Broadcast System was initiated in 1963. So, is it fair to say that deaths from this outbreak would have been at least three times what they were form the outbreak in 1936? Possibly. Is it fair to say that deaths from this tornado outbreak would have been a lot more, say double, if building codes had of not been upgraded to prevent deadly catastrophes from tornadoes? Likely. What about the great advances in warnings made possible because of dopler radar? Very likely. And what about Twitter? Yes, even Twitter has been credited with saving lives during tornado outbreaks. Would this outbreak have caused more fatalities than the 746 during the great Tri-State Tornado Outbreak in March 1925?
A NOAA/National Severe Storms Laboratory study of the 1999 Oklahoma City tornado compared the death toll from that event with what could have been expected if advances in warning technology and building codes had not evolved to their current state today. The Oklahoma City tornado killed 36. The NOAA/Severe Storms Lab says that approximately 500 deaths would have occurred if that tornado happened with the same population as we have today, but our protection technologies were the same as in 1925. If we hypothetically transposed this assumption to this entire outbreak that has just occurred, just to give us an idea, about 5,000 people would have been killed.
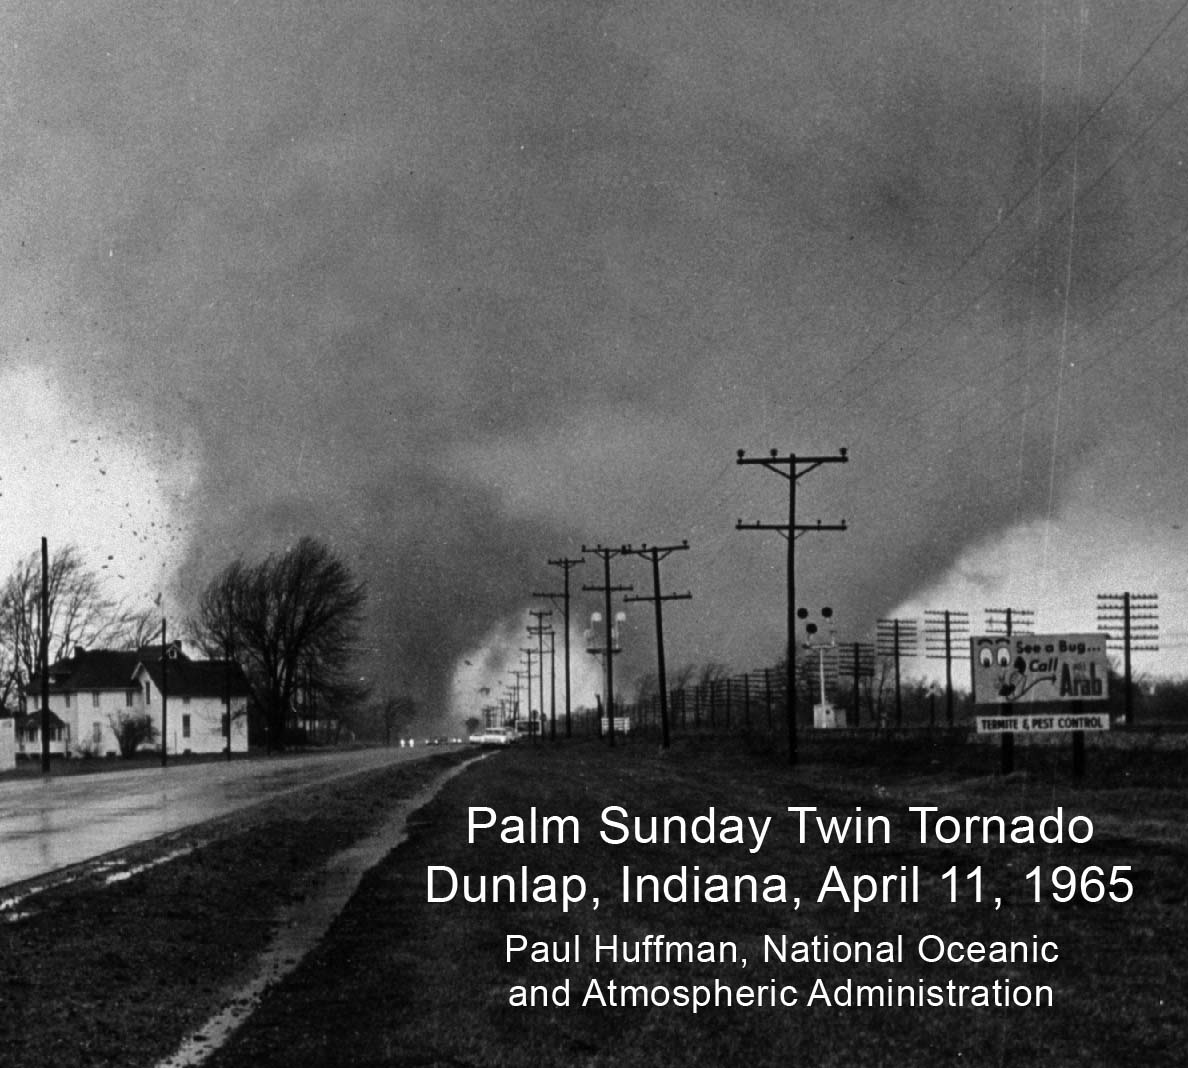 This is by no means an apples to apples comparison, so why am I talking
about this? We must understand what the teevee guy is actually saying
when he says that this was the worst tornado outbreak since 1936 - or
whatever. It can not be argued that hundreds and possibly even thousands of
lives were saved during this tornado outbreak because of early warnings and
new building codes. It can be argued, because of the apples to oranges
comparison, that 5,000 lives were not saved (it may have been more or less
because of the differences in the comparison.) It is important that remember
that many of the comparisons that the television reports uses (or internet
news), simple are not valid. In this case, it just is not possible to
compare today to decades or generations ago. We need to be looking at
something more comparable like the number of tornadoes.
This is by no means an apples to apples comparison, so why am I talking
about this? We must understand what the teevee guy is actually saying
when he says that this was the worst tornado outbreak since 1936 - or
whatever. It can not be argued that hundreds and possibly even thousands of
lives were saved during this tornado outbreak because of early warnings and
new building codes. It can be argued, because of the apples to oranges
comparison, that 5,000 lives were not saved (it may have been more or less
because of the differences in the comparison.) It is important that remember
that many of the comparisons that the television reports uses (or internet
news), simple are not valid. In this case, it just is not possible to
compare today to decades or generations ago. We need to be looking at
something more comparable like the number of tornadoes.
But tornado reports have increased with the increases in population over the years simply because there are more eyes around to see tornadoes when they occur, or more houses to be damaged, and because of greater tornado awareness and better reporting networks. NOAAs Sever Storms Lab has determined how to "normalize" these increasing reports though, through clever (and complicated) statistical techniques, so that we can equally compare, apples to apples, the number of tornadoes that we have every year - at least back to 1954.
So now we can tell, year to year, what is going on with tornadoes from severe weather. This his is exactly what the climate scientists have been telling us about for over twenty years now. The variability in the extremes of the weather will increase as our climate warms. We will not see this ever year, because the opposite is also true, at least somewhat. this sound strange when talking about tornadoes and their being fewer tornadoes some years because of climate change, but another comparison more clearly demonstrates this increase in weather chaos that has been predicted for so long now.
Extremes flood events have been projected all over the world because of climate change. The opposite of this effect is that extremes in drought will increase with climate change. A great example of this impact comes from the United States Southeast. A team at Duke University has found that over the last sixty years, that the extremes of drought and flood have doubled in the southeastern U.S, and their work has excluded all sources of this change except man-caused climate change. (see here)
Brooks and Doswell, Deaths in the 3 May 1999 Oklahoma City Tornado form a Historical Perspective, Weather and Forecasting, Vol 17, 2002. http://journals.ametsoc.org/doi/pdf/10.1175/1520-0434%282002%29017%3C0354%3ADITMOC%3E2.0.CO%3B2
NOAA Storm Prediction Center Inflation Adjusted Annual Tornado Running Total http://www.spc.noaa.gov/wcm/adj.html
April 13, 2010 Our Planet Really is Changed - NASA had to Change the
Scale on Their Global Temperature Maps The earth warms and
NASA quietly adds a new color to their legend to accommodate the change. No
fanfare, no press release. The skeptical denialists did not even dispute the
action. What does it mean?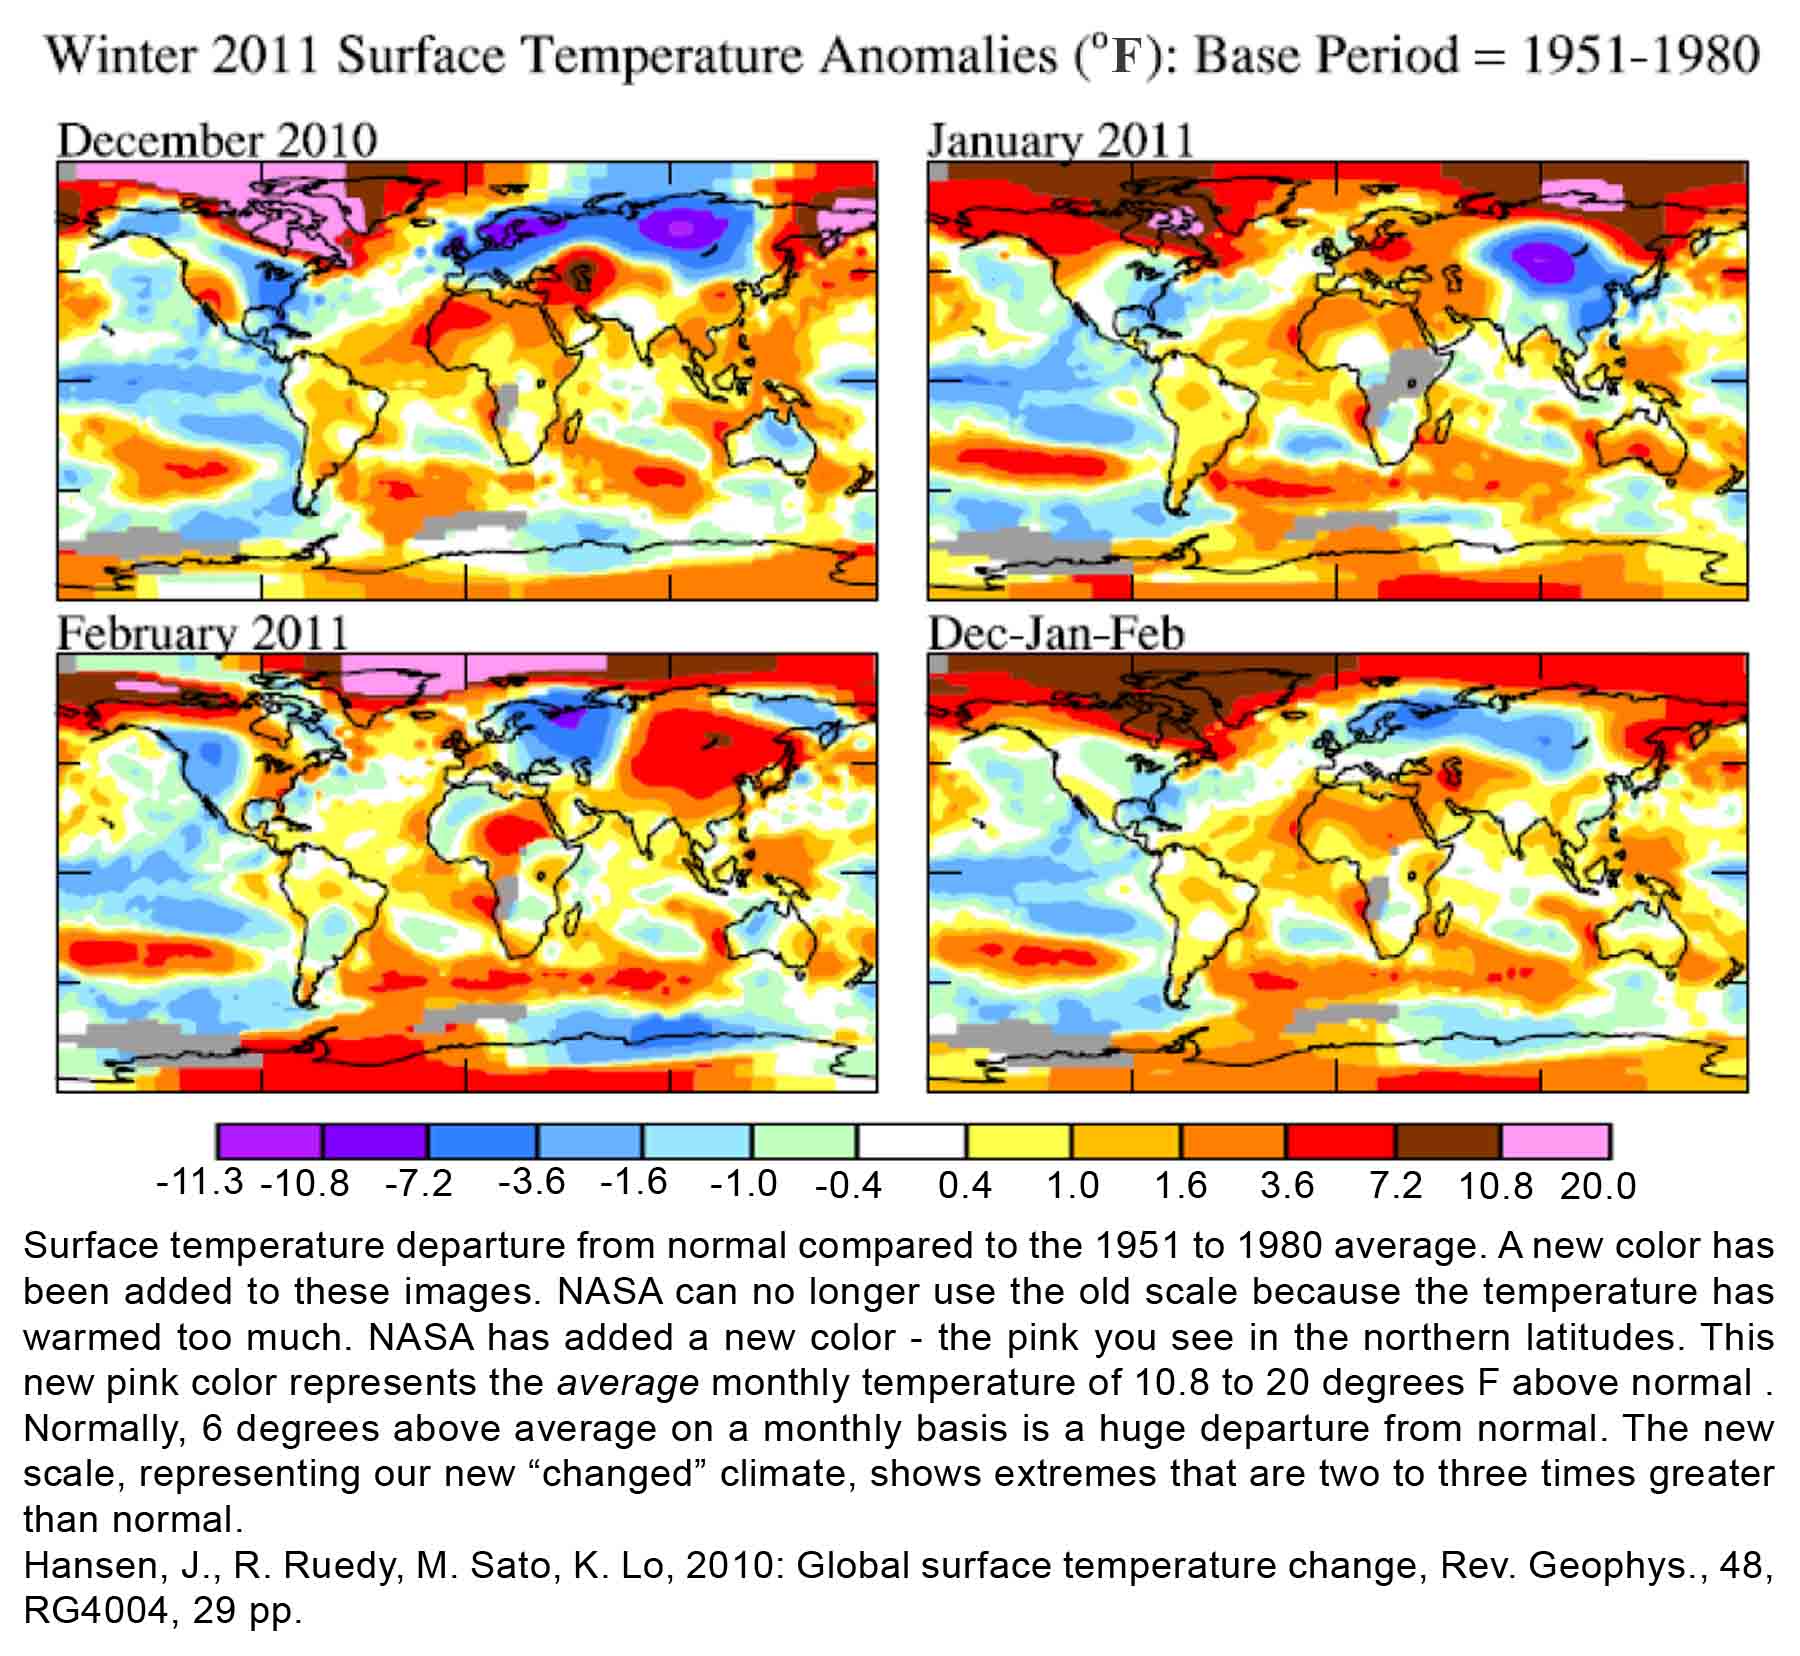
Think of your computer back in the 1990s. Remember how big that first upgrade to a 40 megabyte hard drive was? Then it was a 400 meg drive, then a one gig drive. Now we have hard drives for the home computer that can store two terabytes of information. As storage capacity rose, different words were brought into use to describe the increased capacity: Megabyte - gigabyte - terabyte . . . So now, NASA has added a new color to represent the increased temperatures that we are now recording across this planet. The old scale stopped at 10.8 degrees as the highest monthly average departure from normal. The new pink category maxes out at 20 degrees above normal for the average monthly temperature. The new increased maximum average temperature category gets this new pink color.
We have reached a point in climate change where every decade to come will be the hottest decade ever recorded. Changes have really started to kick in now, the models have been predicting it for twenty years and they are saying that it will get worse faster. Normal climate variation is no longer relevant. Warming is now more than the natural variation. The climate scientists say that the warming has risen above the noise. What they mean is the changes have statistically warmed beyond their past limits. Most suggestions that they are a part of a natural cycle are no longer mathematically valid.
There will be fluctuations in temperature, but there will no longer be a decade that is cooler than the last. They will all be hotter. At least they will all be hotter until we start reducing the carbon loading in our atmosphere - a task that our politicians have made us believe we have already started when in fact, we are rapidly continuing to increase the carbon loading of our atmosphere.
We may even have record cold winters across large parts of the planet. Climate change does not just mean warming. It means that the extremes will become more extreme. Like the pot of water on the stove, the warmer it gets, the more turbulent the water becomes. Our atmosphere is little different. The more energetic our atmosphere is (a warmer atmosphere is more energetic just like a warmer pot of water on the stove), the greater the swings between warm and cold, wet and dry.
The image "Winter 2011 Surface Temperature Anomalies . . . " (above) shows us NASA's new color across parts of the Arctic. It was so warm in the Hudson Bay area of Canada that ice did not form until mid January, a full two months later than normal (see here.)
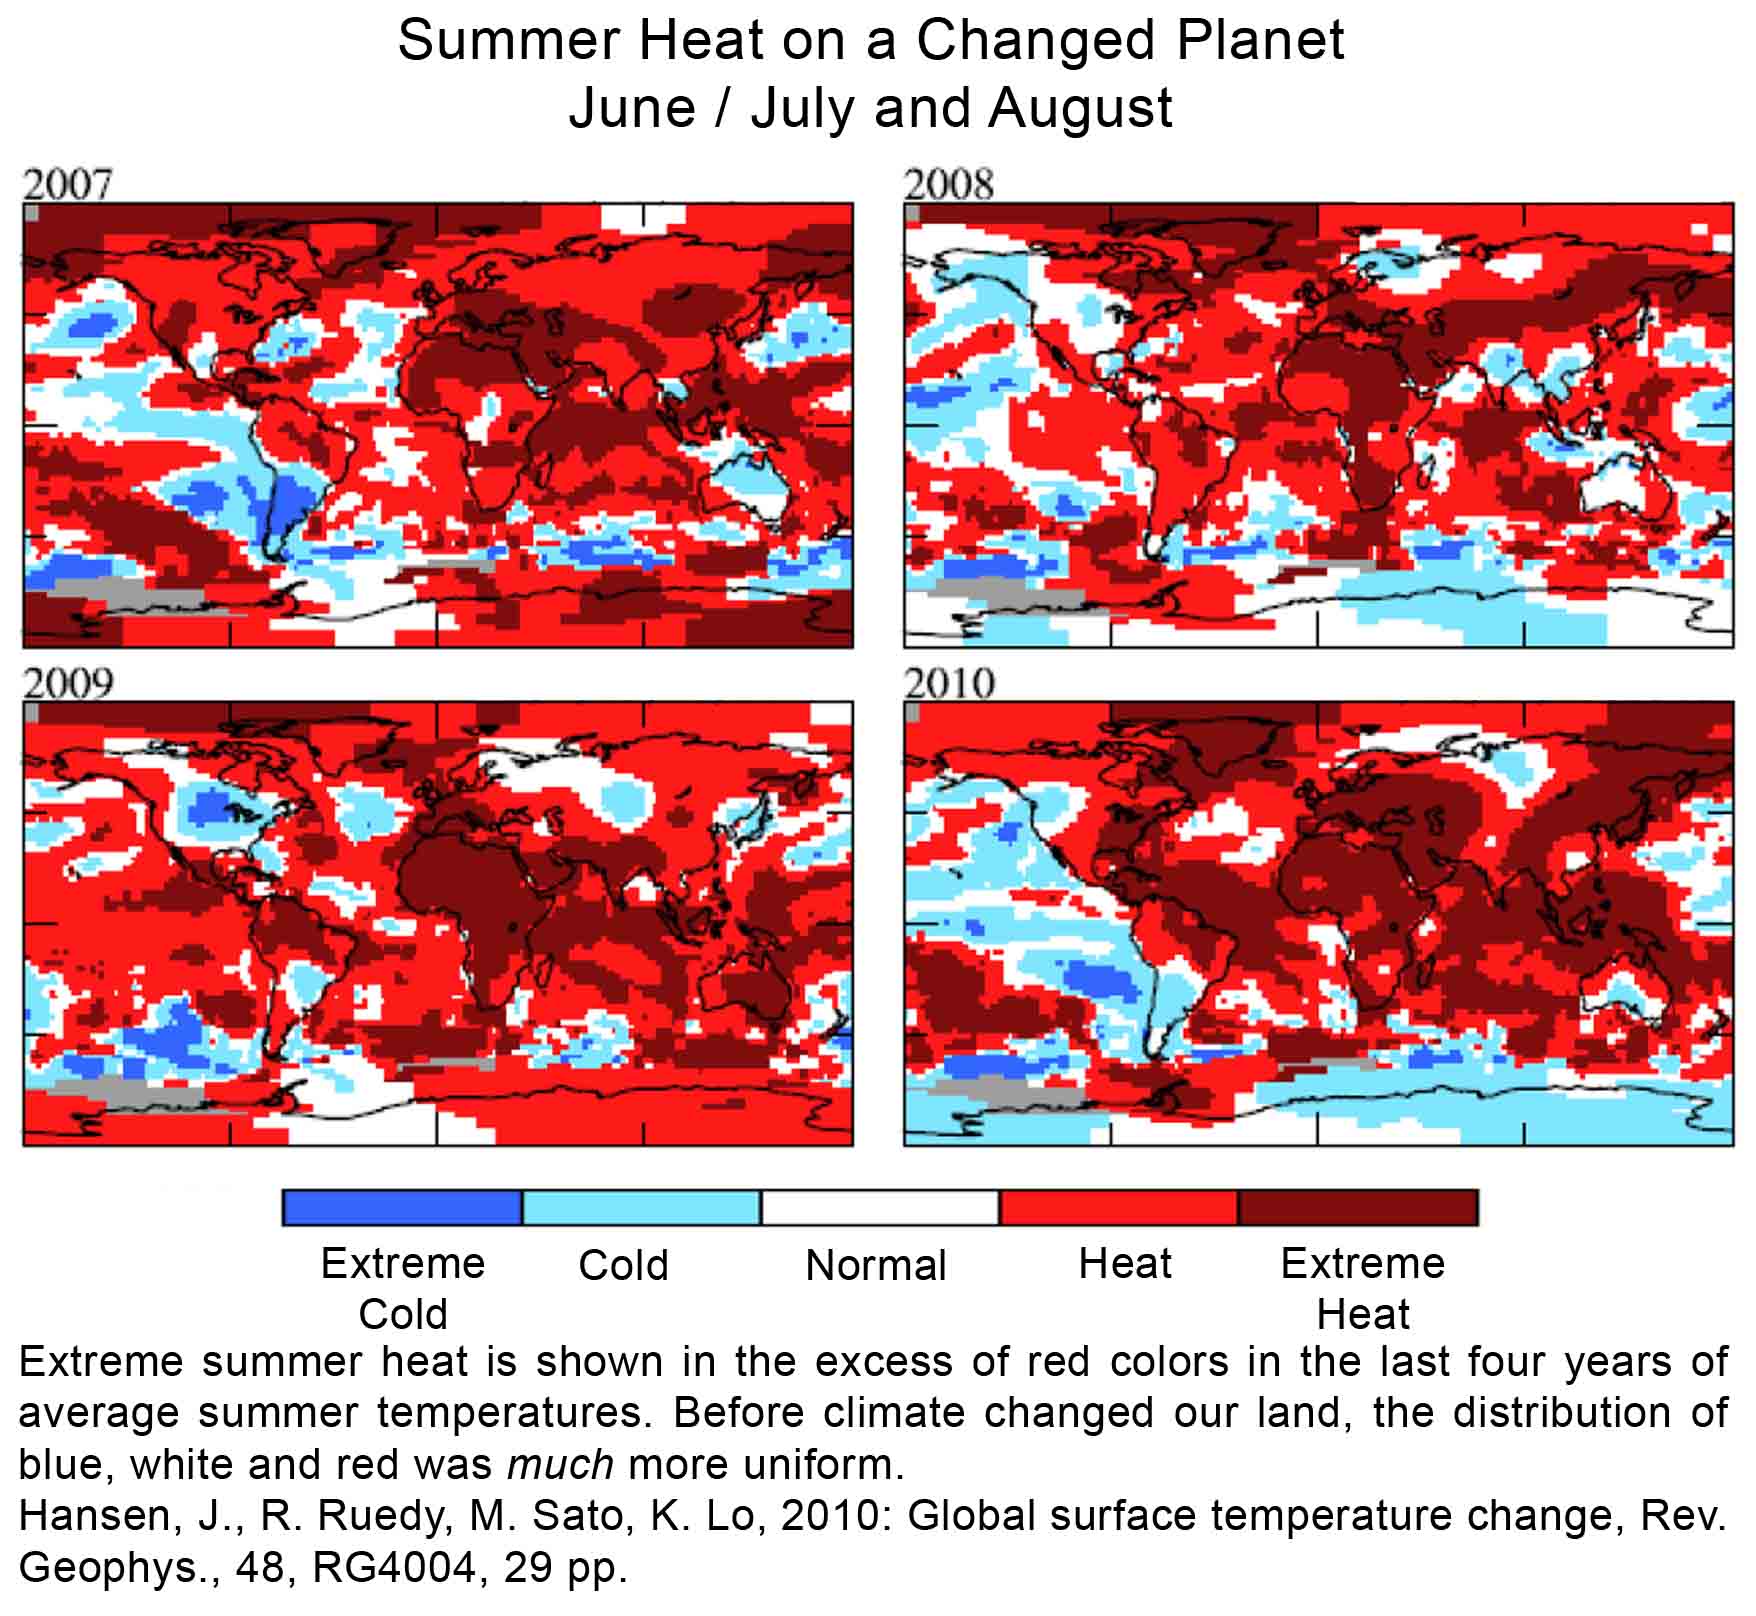 The
image "Summer Heat on a Changed Planet", also from Hansen (2010) should be
showing a relatively equal distribution of red, white and blue, at least
before the warming. Of course, some year to year variance will always occur
with a chaotic climate system. Even a decade or more of warmer than normal or
colder than normal temperature is not out of the question under a stable
climate. The obvious elephant in the room however is that our climate models
have been projecting, or forecasting, this warming since the 1980s.
The
image "Summer Heat on a Changed Planet", also from Hansen (2010) should be
showing a relatively equal distribution of red, white and blue, at least
before the warming. Of course, some year to year variance will always occur
with a chaotic climate system. Even a decade or more of warmer than normal or
colder than normal temperature is not out of the question under a stable
climate. The obvious elephant in the room however is that our climate models
have been projecting, or forecasting, this warming since the 1980s.
It is not hard to imagine these days that the global temperature was the warmest ever last year. Well, maybe in parts of the northeast and parts of Europe. The cooler than normal winters in these regions however have not been unprecedented and cooler than normal seasons, regionally, are still within the range of weather chaos that remains on our planet. Warming has only been between one and two degrees F.
The cooler than normal temperatures and especially the greater than normal snowfalls, where in the United Kingdom, there has been record snows, are another thing that has been evaluated in the scholarly journals. A warmer than normal Arctic has changed the storm track - pushed the jet stream further south, so that even though the Arctic is warmer than ever in recorded history, it is still very cold compared to Europe and the northeastern U.S. The altered jet stream is now able to pull down arctic storms into lower latitudes where they are dumping great amounts of snow. These bigger snowstorms are because - on a warmer planet, our storms become more energetic. (see here)
 April
8, 2010, NASA - Annual 2010 Temperature Hottest Ever: The
yearly average global temperature last year beat out 2005 as the warmest ever by a few
hundredths of a degree. The UK Met, The United Kingdom's national weather
service, tells a little different story, but not much. They had 2011 as the
second warmest ever, just behind 1998. Why the difference? The
Goddard Institute for Space Studies (GISS) showed 2005 as second warmest,
not 1998. What is going on is that eight of the last thirteen years are in
a virtual tie for the warmest year ever. The methodologies for determining the
world's average temperature are a little different between the UK Met and
GISS, so their ranking is a little different. but the fact remains that the
eight warmest years ever recorded 2010, 2009, 2007, 2006, 2005, 2003,
2002 and 1998 are all within 0.05 degrees Fahrenheit of one another. All eight
years are in the top 2.6 percent of the entire annual average global
temperature ranking over the last
131 years.
April
8, 2010, NASA - Annual 2010 Temperature Hottest Ever: The
yearly average global temperature last year beat out 2005 as the warmest ever by a few
hundredths of a degree. The UK Met, The United Kingdom's national weather
service, tells a little different story, but not much. They had 2011 as the
second warmest ever, just behind 1998. Why the difference? The
Goddard Institute for Space Studies (GISS) showed 2005 as second warmest,
not 1998. What is going on is that eight of the last thirteen years are in
a virtual tie for the warmest year ever. The methodologies for determining the
world's average temperature are a little different between the UK Met and
GISS, so their ranking is a little different. but the fact remains that the
eight warmest years ever recorded 2010, 2009, 2007, 2006, 2005, 2003,
2002 and 1998 are all within 0.05 degrees Fahrenheit of one another. All eight
years are in the top 2.6 percent of the entire annual average global
temperature ranking over the last
131 years.
James Hansen, Director of NASAs Goddard Institute for Space Studies, in his paper published in Reviews in Geophysics, has this to say about our future global temperature:
"One sure bet is that this decade will be the warmest in history. Yes, some scientists assert that there is decadal variability and the next decade or two could be cooler. How do we know they are wrong? Because, as we show in reference 4, the planet is now out of balance by about ¾ of a watt per square meter of Earth's surface averaged over the solar cycle. It may not sound like much, but that is a lot of energy (in an interesting unit suggested in a colleague's paper, Sarah Purkey and Greg Johnson?), the ¾ W/m2 corresponds, assuming a global populations of 7 billion, to every man, woman, and child on the planet running simultaneously 40 industrial strength 1400 watt hair dryers 24 hours a day 365 days a year). This energy is enough to cause the ocean to slowly warm and ice to melt all over the planet."
Hansen, J., R. Ruedy, M. Sato, K. Lo, 2010: Global surface temperature change, Rev. Geophys., 48, RG4004, 29 pp.
NASA Press Release: http://www.giss.nasa.gov/research/news/20110112/
April 7, 2011 Dust Bowl Drought will be AVERAGE CONDITIONS Across Much of the U.S., in 20 Years - This study by the National Center for Atmospheric Research (NCAR is sponsored by the National Science Foundation) combines three major areas of climate science in this report and summarizes 137 separate studies. The three focus areas were drought across the world over the last 1,000 years, drought between 1950 and 2008, and our future as seen by the latest climate models.
Says the author: “We are facing the possibility of widespread drought in the coming decades, but this has yet to be fully recognized by both the public and the climate change research community,” Dai says. “If the projections in this study come even close to being realized, the consequences for society worldwide will be enormous.”
From the press release "The term 'global warming' does not do justice to the climatic changes the world will experience in coming decades. Some of the worst disruptions we face will involve water, not just temperature.”
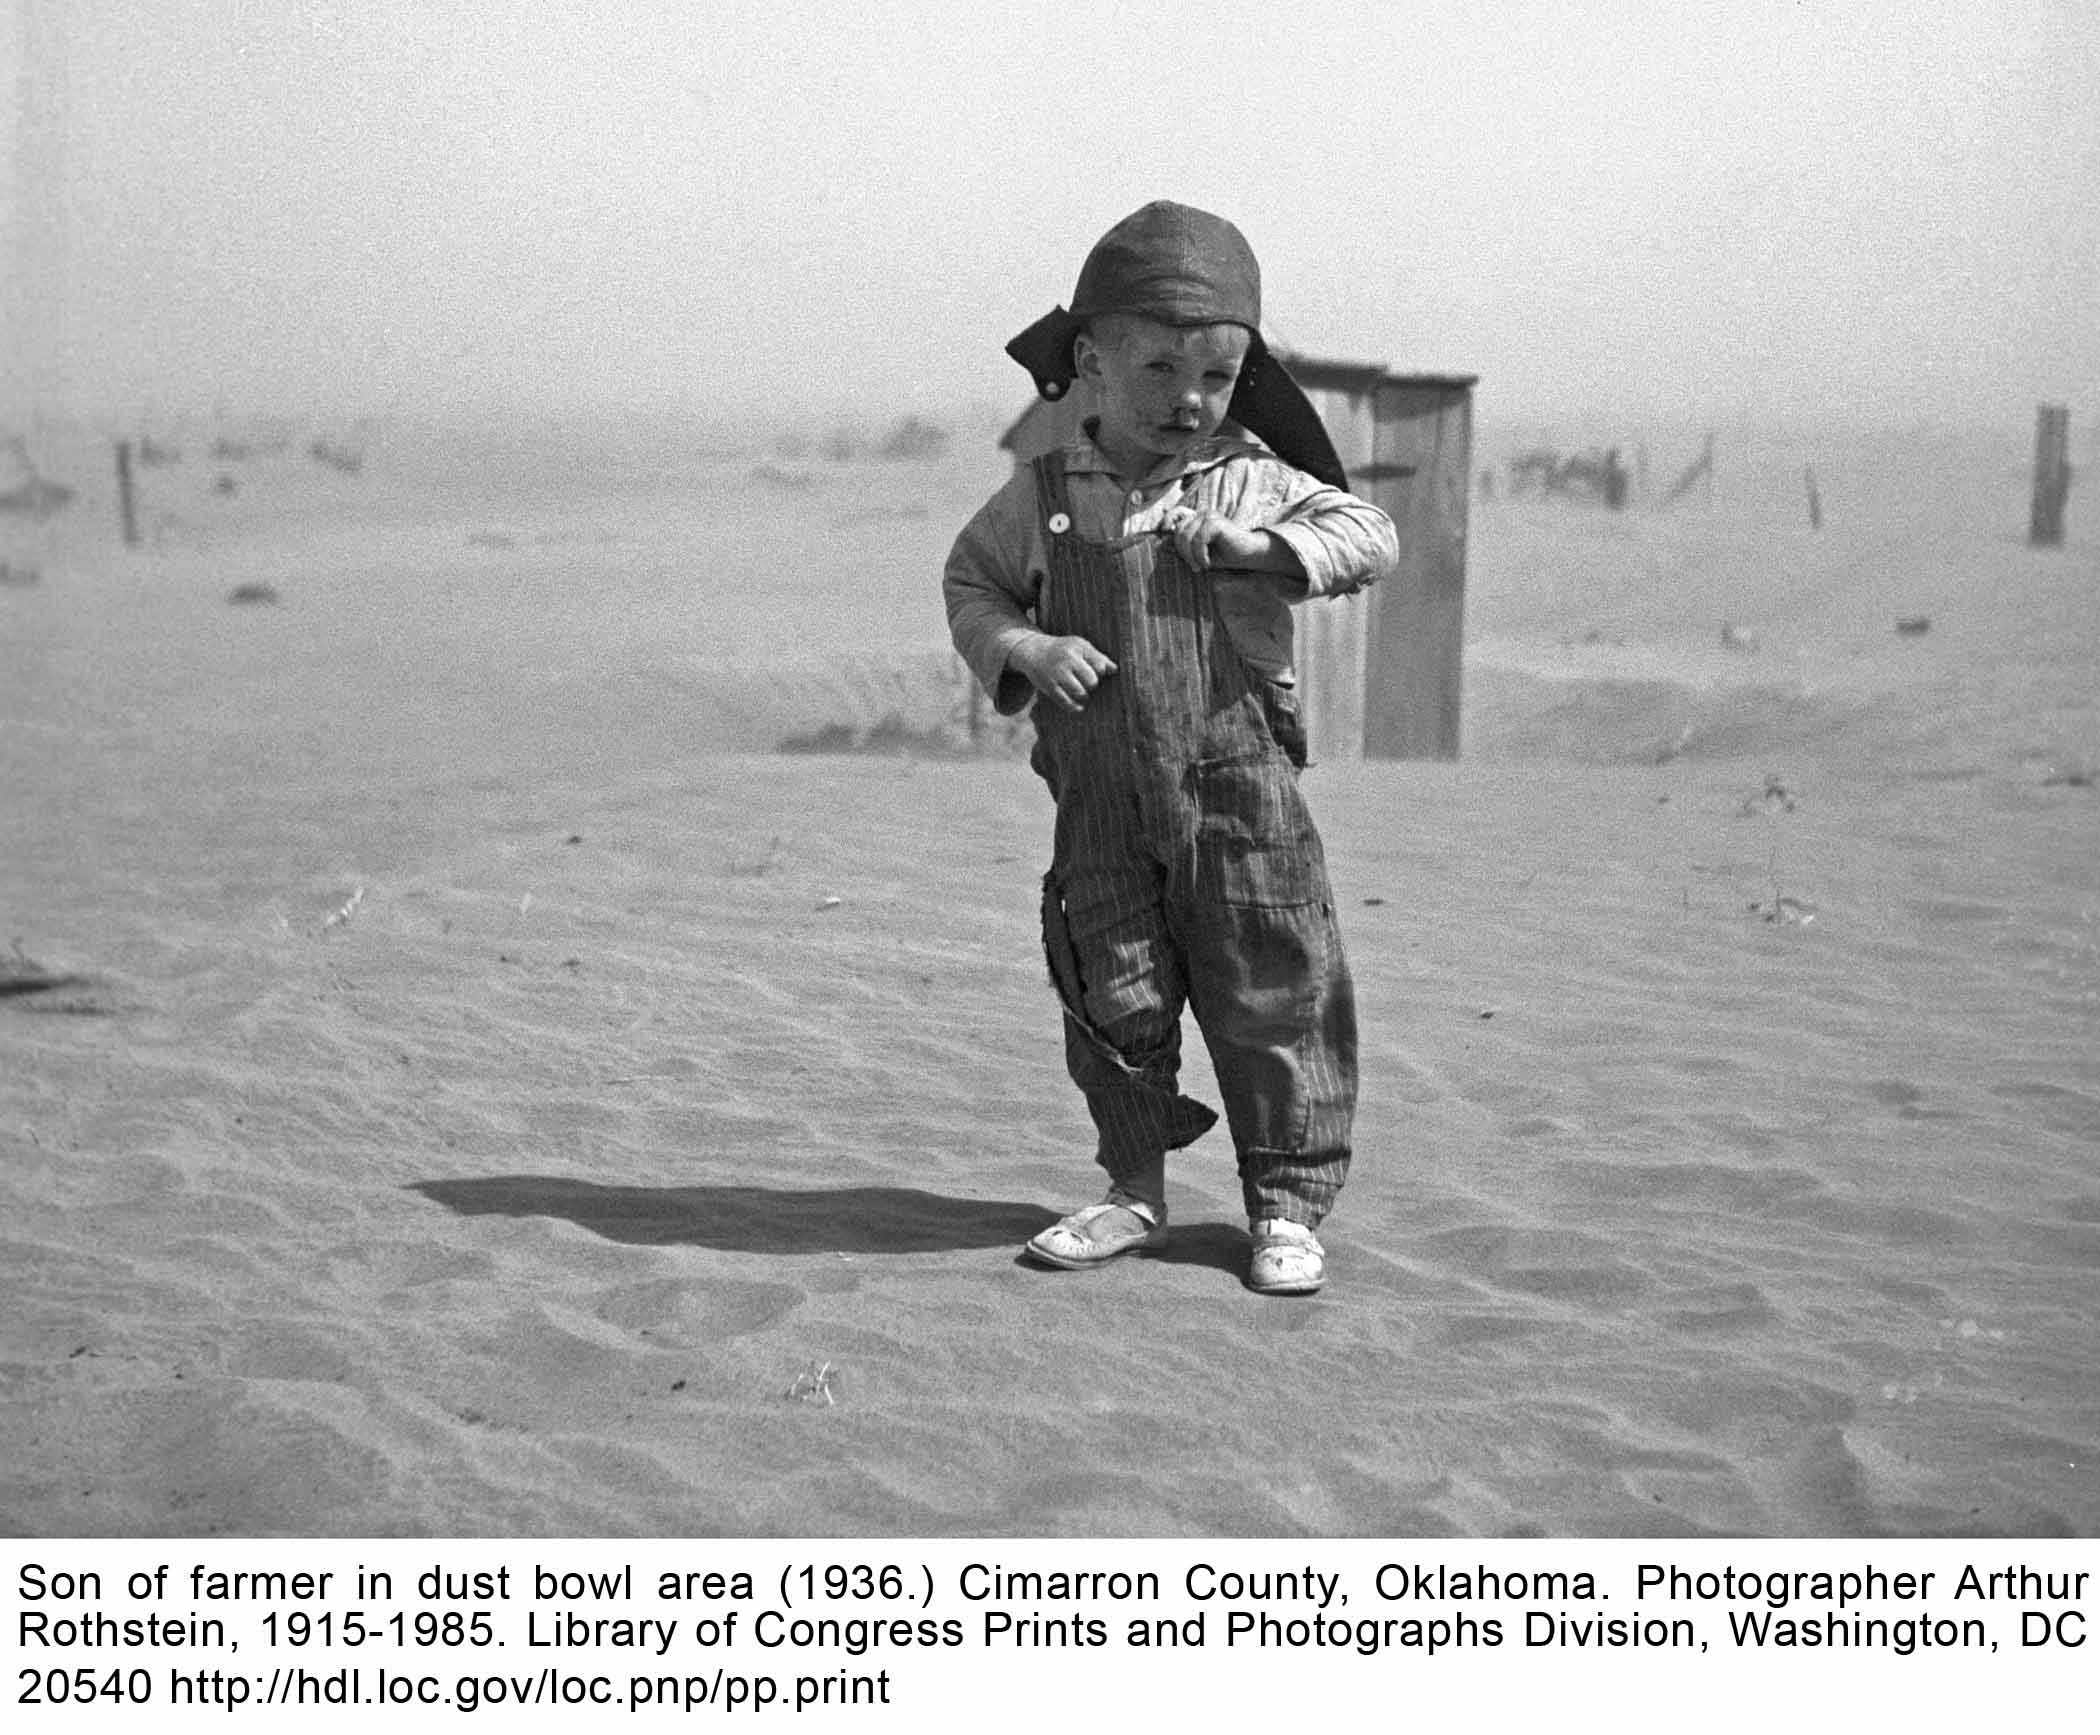 From the NOAA website "The Palmer Drought Severity Index (PDSI) is most
effective in determining long term drought—a matter of several months—and is
not as good with short-term forecasts (a matter of weeks). It uses a 0 as
normal, and drought is shown in terms of minus numbers; for example, minus 2
is moderate drought, minus 3 is severe drought, and minus 4 is extreme
drought." . The Palmer Index varies roughly between -6.0 and +6.0.
From the NOAA website "The Palmer Drought Severity Index (PDSI) is most
effective in determining long term drought—a matter of several months—and is
not as good with short-term forecasts (a matter of weeks). It uses a 0 as
normal, and drought is shown in terms of minus numbers; for example, minus 2
is moderate drought, minus 3 is severe drought, and minus 4 is extreme
drought." . The Palmer Index varies roughly between -6.0 and +6.0.
Or at least it has in the past. This is the extent to which droughts have driven the index. What I mean by "driven" is, the Index is a complicated piece of math that takes several things into consideration like rainfall, ground moisture, wind, and the angle of the sun - all things that can increase evaporation or that increased evaporation impacts. These things, when put together the way the Palmer Index puts them together, can mean virtually the same thing for most places on Earth.
A Palmer Drought Severity Index number (PDSI) of between -4 and -6, as we
saw in the Great Plains during the Dust Bowl, was an extreme drought. Just
inches of rain fell each year for nearly a decade. In the Amazon however, an
extreme drought might still see 20 or 30 inches of rain, but this would
be so much less than normal that the existing environment would be in
deep trouble. It all depends on what is normal. This is what the PDSI is so
good at. It can compare the relative amount of drought stress in very
different regions across the planet.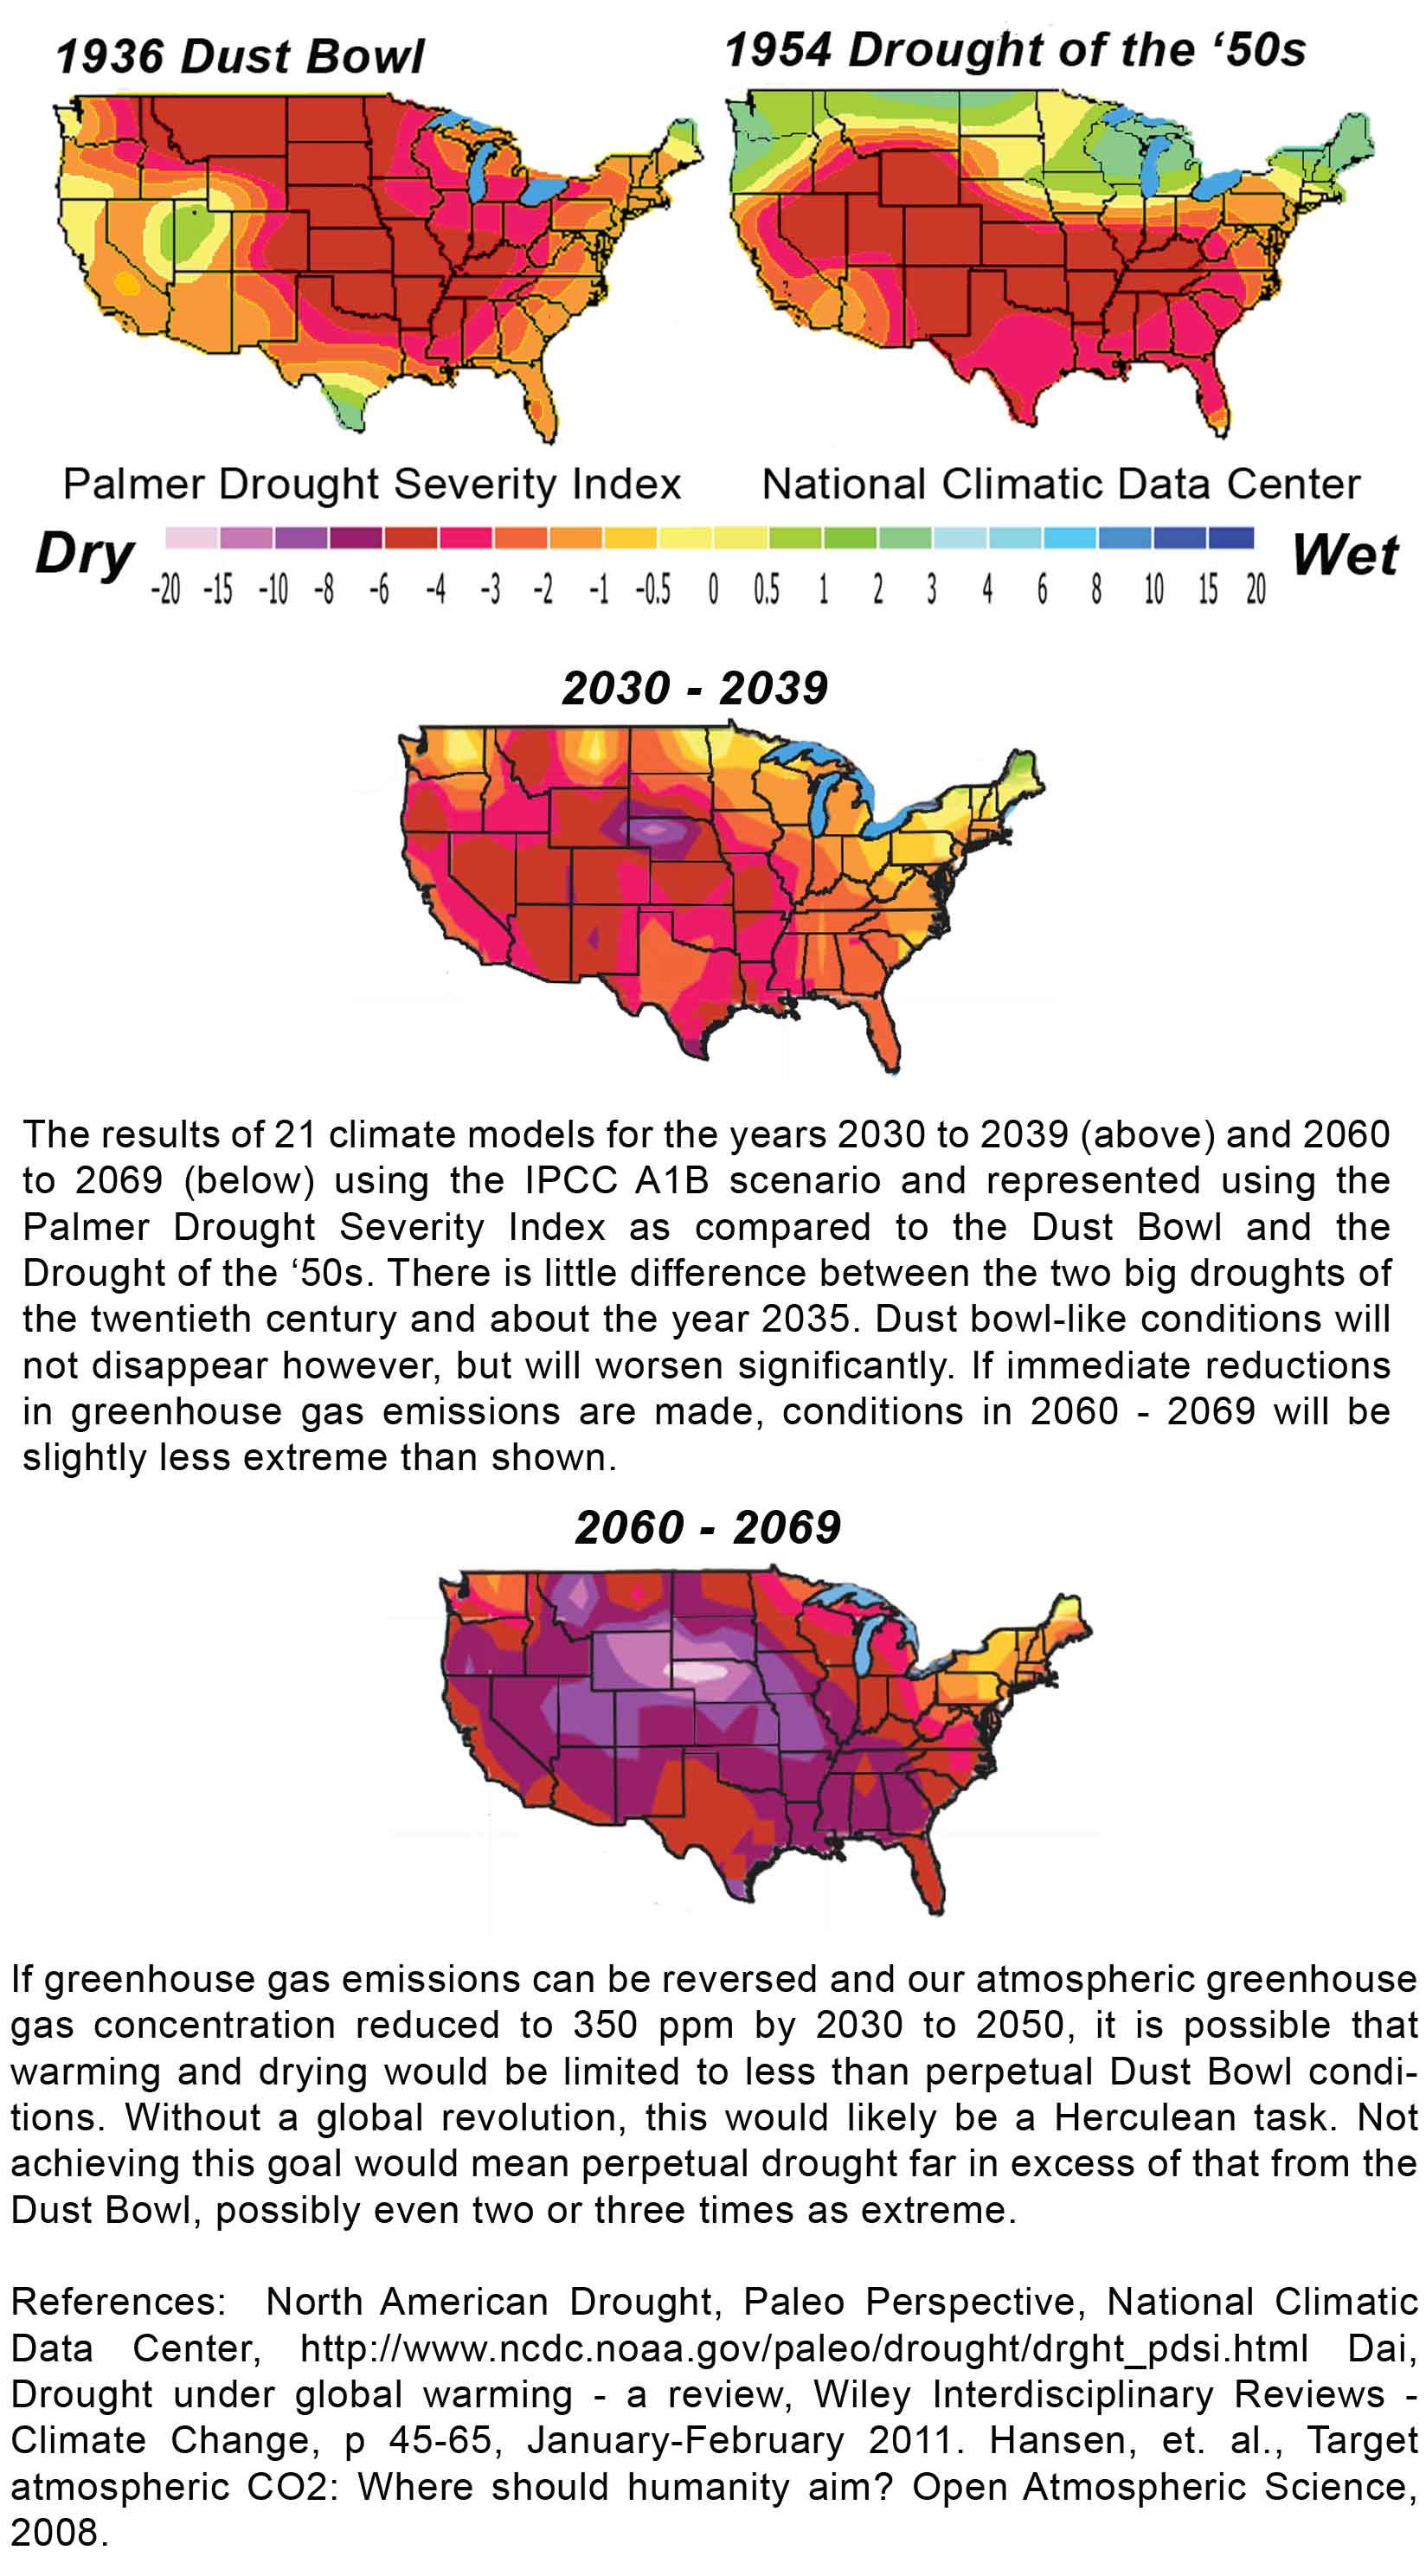
These detailed model runs are shedding new light on the extent of drought in coming years. Starting in just fourteen years, beginning in 2030, drought conditions across much of the United States will be similar to what was seen during the worst year of the Dust Bowl and the worst year of the similar Drought of the 1950s. This is the average conditions, not the worst year of the drought. The worst year of drought during this ten year period will be even worse than shown.
Then conditions will worsen. In fifty years, the PDSI will be two to three times as extreme as the Dust Bowl! This type of information is simply unimaginable yet, our climate scientists have been warming us of possible desertification of the interior of continents for decades.
Now, as usual, I have even worse news. These modeling scenarios were done with the A1B scenario of the IPCC. This scenario is NOT the worst case scenario. What the A1B scenario states is that our planet will be carrying on with a pretty fossil fuel intensive society, but that significant emissions cuts will have already been made, with even more cuts ongoing.
Now, what is going on today on our poor mistreated planet is that emissions have risen to being as extreme as what the IPCC expects in their worst-case scenario, today, right now. (see here) So what does this likely mean? That drought will be even worse than these dismal projections?
The answer is probably yes. But the authors do say their projections could be overly extreme. And... they also say that they could underestimate the rapidity of runoff from future storms that are expected to continue the already demonstrated trend of more rain falling faster. This means that less water soaks in because it runs off faster and drought intensifies.
So now is one of those times that I like to remind everyone that things are indeed darkest just before the storm. We are seeing the light disappear on the horizon. The future indeed looks dismal. But I am confident that the solutions already exist in the labs and in the papers of our scientists. We just need to start spending some money on these things. Our planet is a terrible thing to waste. Earth is really after all, too big to fail.
I ran across a passage in one of Dr. Hansen's older papers this afternoon, when I was researching the caption in the frightening piece of climate science are above. Dr. Hansen used the same analogy that I have been using, about our society meeting extreme global challenges like this before.
From Hansen's Target CO2 "Present policies, with continued construction of coal-fired power plants without CO2 capture, suggest that decision-makers do not appreciate the gravity of the situation. We must begin to move now toward the era beyond fossil fuels. Continued growth of greenhouse gas emissions, for just another decade, practically eliminates the possibility of near-term return of atmospheric composition beneath the tipping level for catastrophic effects. The most difficult task, phase-out over the next 20-25 years of coal use that does not capture CO2, is Herculean, yet feasible when compared with the efforts that went into World War II. The stakes, for all life on the planet, surpass those of any previous crisis. The greatest danger is continued ignorance and denial, which could make tragic consequences unavoidable."
From the Press Release: Dai turned to results from the 22 computer models used by the IPCC in its 2007 report to gather projections about temperature, precipitation, humidity, wind speed, and Earth’s radiative balance, based on current projections of greenhouse gas emissions. He then fed the information into the Palmer model to calculate the PDSI. A reading of +0.5 to -0.5 on the index indicates normal conditions, while a reading at or below -4 indicates extreme drought. The index ranges from +10 to -10 for current climate conditions, although readings below -6 are exceedingly rare, even during short periods in small areas. By the 2030s, the results indicated that some regions in the United States and overseas could experience particularly severe conditions, with average decadal readings potentially dropping to -4 to -6 in much of the central and western United States as well as several regions overseas, and -8 or lower in parts of the Mediterranean. By the end of the century, many populated areas, including parts of the United States, could face readings in the range of -8 to -10, and much of the Mediterranean could fall to -15 to -20. Such readings would be almost unprecedented. Dai cautions that global climate models remain inconsistent in capturing precipitation changes and other atmospheric factors, especially at the regional scale. However, the 2007 IPCC models were in stronger agreement on high- and low-latitude precipitation than those used in previous reports, says Dai. There are also uncertainties in how well the Palmer index captures the range of conditions that future climate may produce. The index could be overestimating drought intensity in the more extreme cases, says Dai. On the other hand, the index may be underestimating the loss of soil moisture should rain and snow fall in shorter, heavier bursts and run off more quickly. Such precipitation trends have already been diagnosed in the United States and several other areas over recent years, says Dai. “The fact that the current drought index may not work for the 21st century climate is itself a troubling sign,” Dai says.
...Now the wind grew strong and hard,
it worked at the rain crust
in the corn fields.
Little by little the sky
was darkened by the mixing dust,
and the wind felt over the earth,
loosened the dust and carried it away.
...from The Grapes of Wrath,
written by John Steinbeck.
Hansen, et. al., Target CO2, Where should humanity aim? Open Atmospheric Science Journal, 2008, NASA Goddard Institute for Space Studies, Yale, Sheffield University, Boston University, Wesleyan University, Boston University, Columbia University, University of California, Santa Cruz, www.columbia.edu/~jeh1/2008/TargetCO2_20080407.pdf
NCAR Press Release: http://www2.ucar.edu/news/2904/climate-change-drought-may-threaten-much-globe-within-decades
Dai, Drought under global warming - a review, Wiley Interdisciplinary Reviews - Climate Change, p 45-65, January-February 2011
http://onlinelibrary.wiley.com/doi/10.1002/wcc.81/full
April 1, 2011 How Not to Change A Climate Contrarians Mind http://www.newscientist.com/article/mg20928043.300-how-not-to-change-a-climate-sceptics-mind.html?DCMP=OTC-rss&nsref=climate-change
March 24, 2011 Distrust of climate science due to lack of media literacy: http://www.physorg.com/news/2011-03-distrust-climate-science-due-lack.html
March 23, 2011 Back to the future with mummified trees http://www.physorg.com/news/2011-03-future-mummified-trees.html
March 21, 2011 The Crystal Ball: Ancient Hyperthermals 55 Million Years Ago Show Rapid Warming that Lasted Thousands of Years
Scripts press release: http://scrippsnews.ucsd.edu/Releases/?releaseID=1147
http://www.nature.com/nature/journal/v471/n7338/full/nature09826.html
March 20, 2011 Warming Ocean Waters Around Antarctica Allow King
Crabs Migrate to the Antarctic Ocean for the First Time In 40 Million Years
- Sounds good? More king crab is always good! Except when you are the
vast southern oceans biologic community that has not seen claws or pinchers
for forty million years. This development has been caused by a warming
southern ocean, that is of course attached to the rest of the world's oceans
that are
 warming
because of climate change. The southern ocean (in the area of this
study) has warmed about one degree. This is enough to let the crabs move in.
warming
because of climate change. The southern ocean (in the area of this
study) has warmed about one degree. This is enough to let the crabs move in.
The results will likely be a rapidly exploding crab population as they exploit the existing food sources that have no defenses against crabs. The crab population could then easily create an extinction event for the crabs favorite food, or not, it is hard to tell what actually will happen. In instances similar to this in other areas, the extinction event often occurs, or at least, a vastly different ecosystem is created.
In the "big picture", this is all just another part of life. These kinds of changes have happened uncountable times across the planet as Earth's climate has change in the past. But in the past, Earth did not support 7.6 billion Homo sapiens, dependent upon her for natural resources and ecosystem services like those found in the southern ocean.
A great cold sea surrounds Antarctica and is corralled away from the rest of the world's oceans by a massive circular ocean current that completely encloses Antarctica. Inside this current, called the Circumpolar Antarctic Current, life is cold, really cold. Outside the current things are cool, but nothing to write home about.
What important ecosystem services? The Antarctic ocean provides one of the greatest primary productivity areas in the world. This means that a significant portion of world carbon sequestration and oxygen production comes from there. Will this change impact those services? Likely. Good or bad? Can't tell yet.
Hall, S. & Thatje, J. Temperature-driven biogeography of the deep-sea family Lithodidae (Crustacea: Decapoda: Anomura) in the Southern Ocean. Polar Biology (published online, October 2010). DOI:10.1007/s00300-010-0890-0 http://www.springerlink.com/content/08660kl518702343/
Press Release: http://www.southampton.ac.uk/mediacentre/news/2010/nov/10_117.shtml
March 19, 2011 Extreme Heat Waves to Increase Five to Ten Times in the Next 40 Years. Europe and Russia's 2010 Heat Wave Was the Biggest in at Least 500 Years - Abstract below.
The summer of 2010 was exceptionally warm in eastern Europe and large parts of Russia. We provide evidence that the anomalous 2010 warmth that caused adverse impacts exceeded the amplitude and spatial extent of the previous hottest summer of 2003. "Mega-heat waves" such as the 2003 and 2010 events broke the 500-year-long seasonal temperature records over approximately 50% of Europe. According to regional multi-model experiments, the probability of a summer experiencing "mega-heat waves" will increase by a factor of 5 to 10 within the next 40 years. However, the magnitude of the 2010 event was so extreme that despite this increase, the occurrence of an analogue over the same region remains fairly unlikely until the second half of the 21st century.
Barriopedro et. al., The Hot Summer of 2010: Redrawing the Temperature Record Map of Europe, Science, March 17, 2011.
http://www.sciencemag.org/content/early/2011/03/16/science.1201224
March 17, 2011 NASA JPL
Polar Ice loss continues - GRACE http://www.jpl.nasa.gov/news/news.cfm?release=2011-070
Real Climate "This rate of melting is more than was figured into the tabulated IPCC AR4 estimates of sea level rise, and any further acceleration will obviously make the discrepancy worse. Indeed, even in the highest forcing A1F1 scenario, the IPCC calculated only a 0.3 mm/year contribution from the ice sheets averaged over the whole 21st Century! This was clearly a gross underestimate" http://www.realclimate.org/index.php/archives/2011/03/under-and-over-the-ice/
March 13, 2011 Climate Quake - Think There is No Way that Climate
Change Could Cause Earthquakes? Think Again! I have been
reading articles about the impacts of warming on solid earth for years now.
It is only logical to think that warming would have an impact on solid
earth. Everything expands as it warms. Earth is no exception.
This expansion would be realized, likely, at fault zones. These pre-cracked
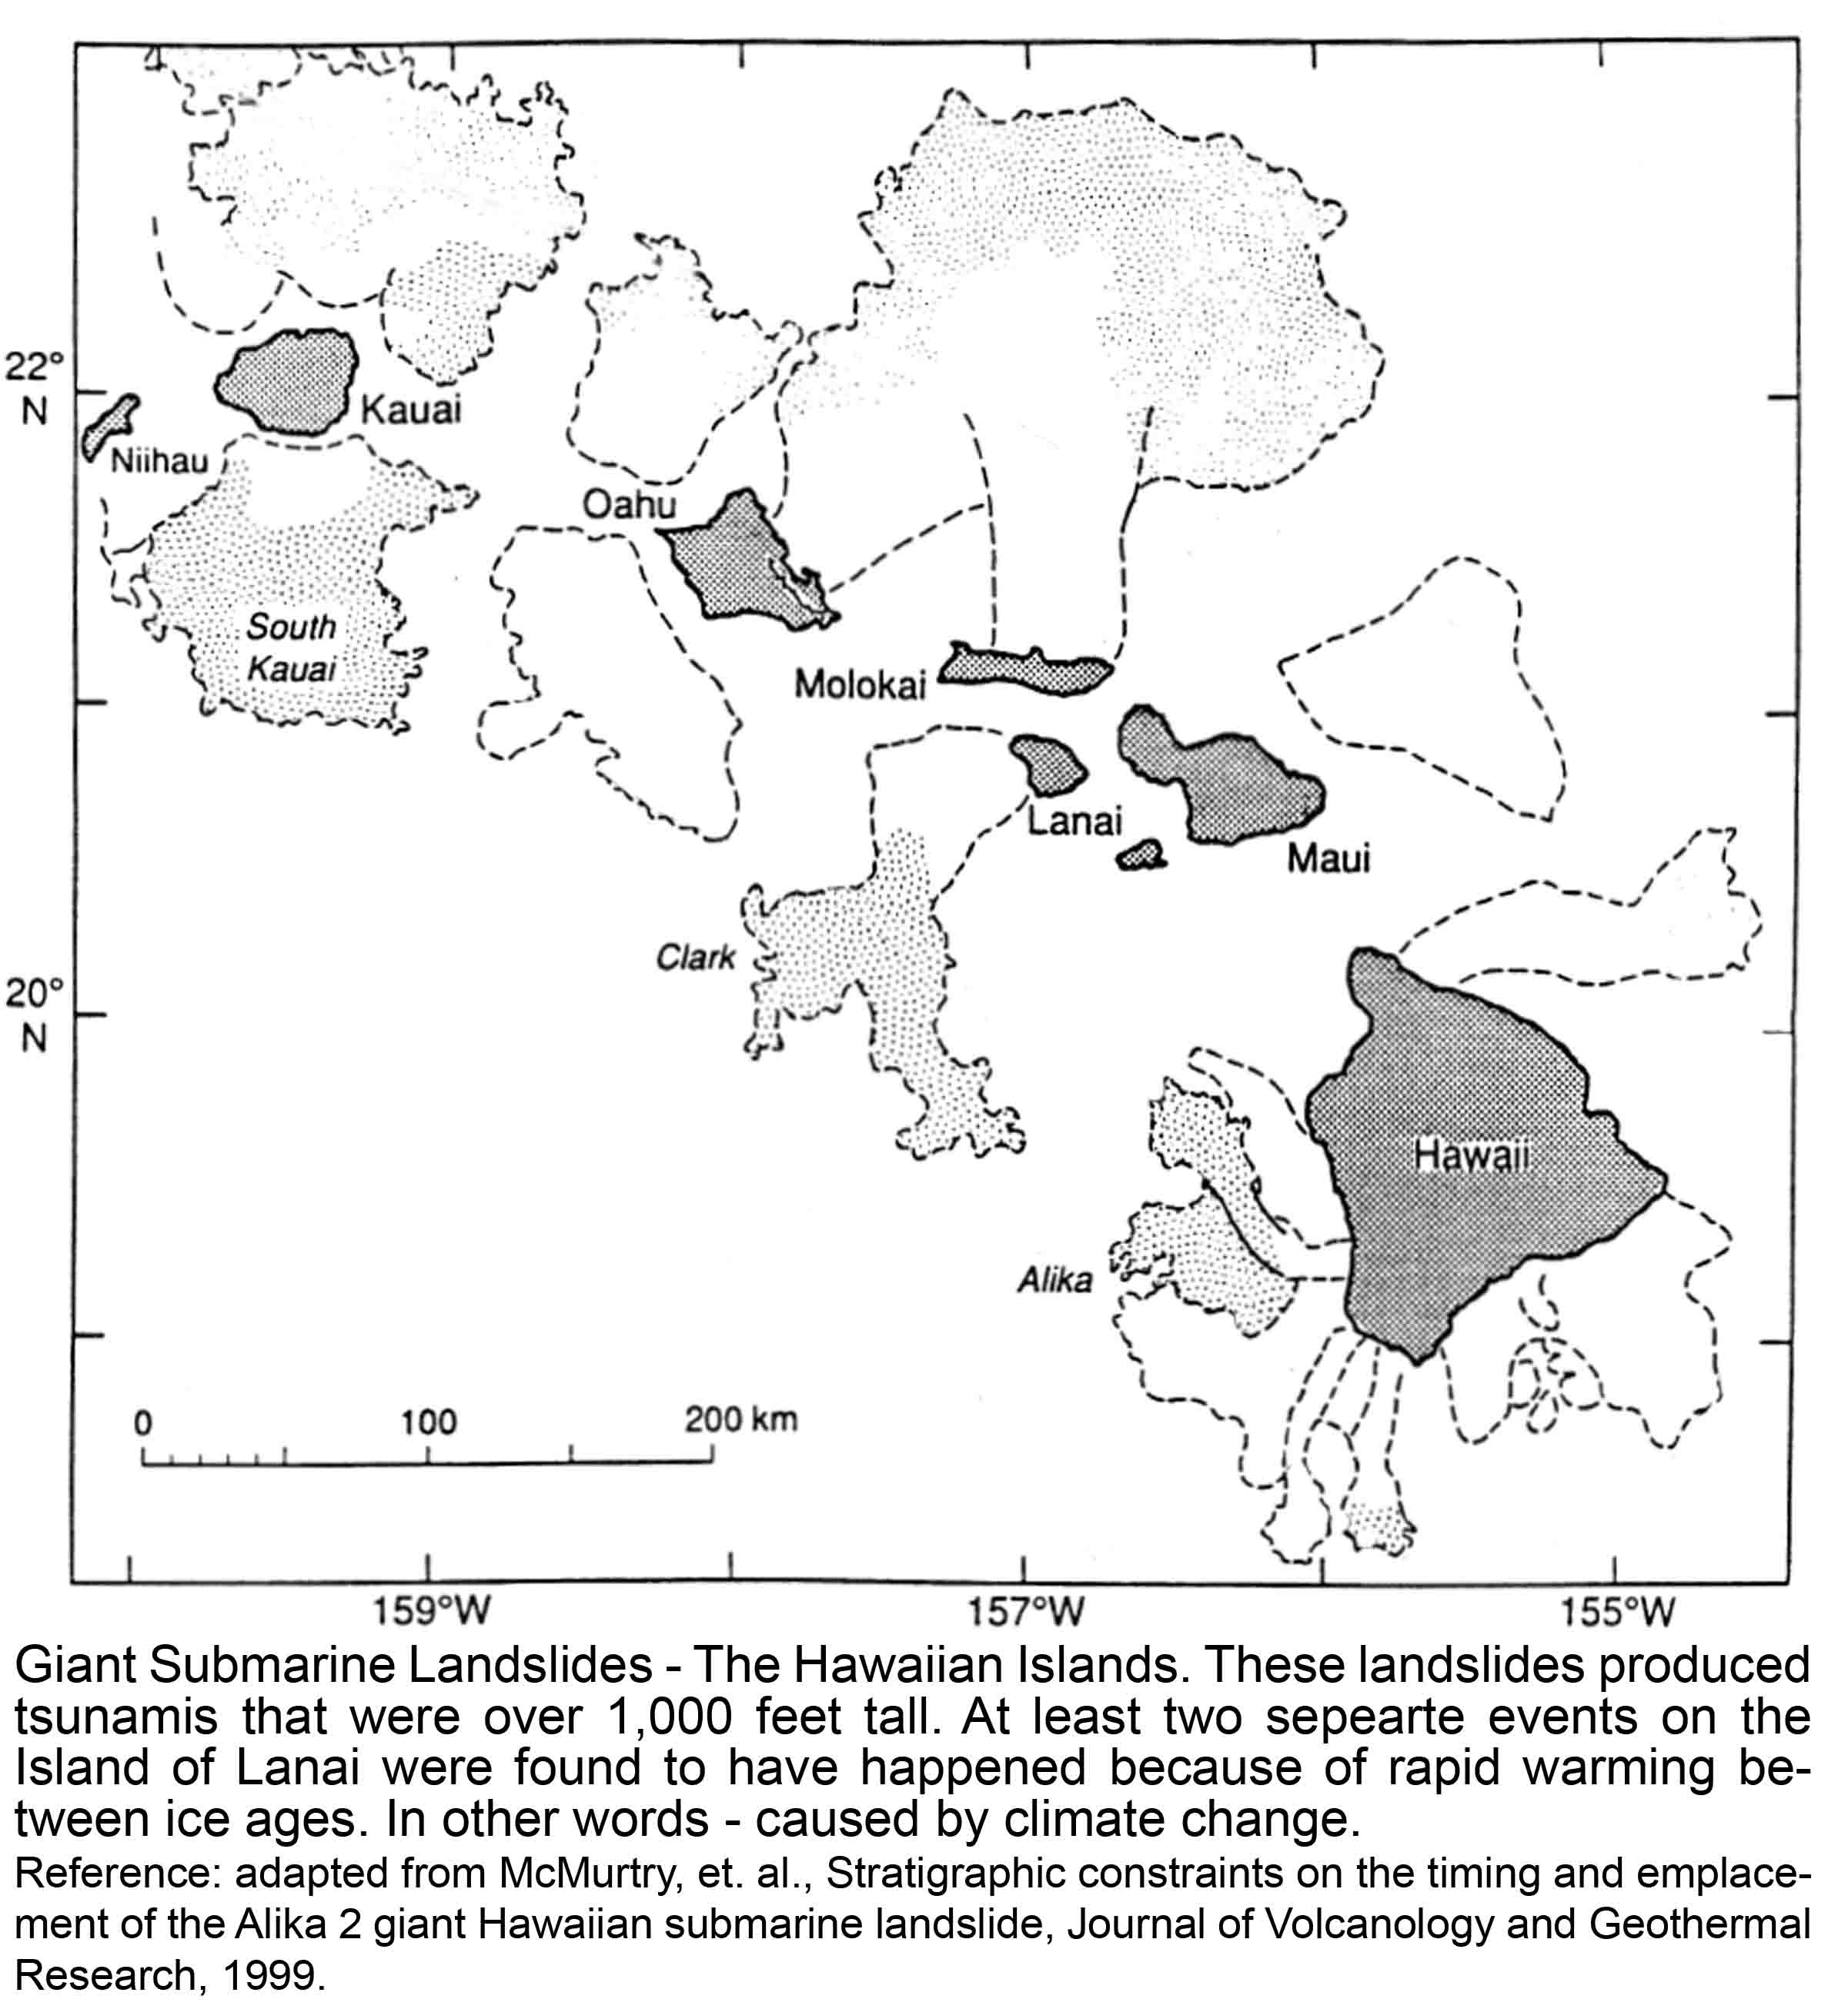 areas
of our planet would more easily be able to move as the Earth expanded with
warmer temperatures. That movement of course is an earthquake.
areas
of our planet would more easily be able to move as the Earth expanded with
warmer temperatures. That movement of course is an earthquake.
Everyone knows what happens to an asphalt or concrete road on a really hot summer day. It buckles. The buckling is caused by heat expansion. The same thing happens to the earth's crust. Limestone expands 16 inches per degree Fahrenheit warming per mile, or over 130 feet per 100 miles (about the same as concrete or steel. Granite expands only about half as much as limestone. The circumference of Earth is 24,900 miles, so for every degree of warming, the skin of the earth expands 56 miles.
You might think: The temperature changes a lot more than 1 degree F every day across the planet, especially from season to season. Your thought would of course be correct, but it is not the daily change in temperature that matters. Our planet is accustomed to moving about with the daily, or seasonal changes in temperature. The system breaks down though when the average temperature changes.
These papers I have been coming across from time to time have now started to become more frequent in their appearances. What they are saying is not comforting. It turns out that although getting the data to associate a warming planet with earthquakes and such is extremely difficult, once the data is acquired, the association just sort of falls out into a big smelly pile of anxiety about the future we are creating for this planet.
Not only are earthquakes associated with climate change, but so are tsunamis of course and volcanic eruptions, terrestrial and submarine landslides, methane outbursts from methane frozen on the ocean floor, ice avalanches from glacial collapse, and etc. The real surprise though is the size of some of these events.
I mentioned that collecting the data was the hard part. Much of the data comes from the ocean floor, which we supposedly know less about than the moon. There is long-studied evidence on the ocean floor of what are called GSLs or Giant Submarine Landslides. The scars from these giant landslides can run for hundreds of miles and involve blocks of earth that tumble in-whole that are a mile across. Some of the debris fields in Hawaii from these mega submarine landslides are bigger than the big island of Hawaii itself.
What happens then, when a mega submarine landslide happens? A mega tsunami, or course. And this is the scary part, especially today considering the tsunami in Sendai, Japan. When a mega tsunami happens, sometimes it leaves evidence for hundreds of thousands of years. This is just what scientists are beginning to find in various parts of the world - once they know what they should be looking for.
On Lanai, (one of the Hawaiian Islands) has a scar where topsoil was stripped from the side of the island, in a way that a landslide would not have behaved, that reaches 1,200 vertical feet up the side often mountain. The caused is believed to be a giant landslide on the flank of the Moana Loa volcano. This unbelievable event was 40 times taller than the Sendai tsunami. There is one that is 800 feet high on Kahoolawe.
The marine geologist studying these events used their computer models to simulate this giant slide and tsunami and found a really good agreement between the tsunami and the landslide. They have also modeled some of the bigger landslides, no sorry, this 1,200 foot tsunami was not one of the really big ones, I am sorry to say. For the really big GSLs they get tsunamis over 2,600 feet tall - yes, half a mile high. This half mile tall wave is only associated with a five kilometer long stretch of Hawaii at Ho'okena beach.
So these things existed in the prehistoric past. How often did they go off? The answer is likely - way to regularly. The two events evaluated in this paper by McMurtry at the school of Ocean and Earth Science and Technology at the University of Hawaii, took 100,000 years to happen. But dozens of scars are evident around the Hawaiian Islands.
It is this ocean volcanoes type of island that causes all of the trouble.. Islands like those found in Japan, or the Aleutian islands, of Iceland, or New Zealand, or the Canary Islands in the mid Atlantic. They are really everywhere, and everywhere they are , there have been giant landslides and mega tsunamis.
So like Mark Twain says, "What gets us into trouble is not what we don't know. It's what we know for sure that just ain't so". The two events evaluated in this study happened during the last two interglacial warm periods between ice ages. They date to about 120,000 years ago and 240,000 years ago. They happened as Earth was warming dramatically out of the ice ages into interglacial warmth - just like what has been going on in the last 10,000 years.
But now we have a new twist. We are again rapidly warming the planet, only this time the warming is beginning at the warmest point, or within about 1.5 degrees F or the warmest point in the last 1.35 million years. And CO2 concentrations are rising 14,000 times faster (yes, I said 14,000 times faster) than the long-term average rate for the last 610 million years.
So, next time someone says that GW and increased seismic activity is a crock, Tell them about McMurtry at the University of Hawaii.
The rest of the story? Check out the Royal Philosophical Society (the United Kingdom's National Academy of Sciences.) They released a special edition of their journal The Philosophical Transactions of the Royal Society, last May. I believe there were fifteen different articles on the impacts of a warming climate on solid earth.
Philosophical Transactions of the Royal Society: Climate forcing of geological and geomorphological hazards - http://rsta.royalsocietypublishing.org/content/368/1919.toc
McMurtry, et. al., Giant landslides, mega-tsunamis, and paleo-sea level in the Hawaiian islands marine geology marine Geology 2004. Abstract Link
National Geographic: http://news.nationalgeographic.com/news/2008/03/080314-warming-quakes.html
March 6, 2011 Lowest February Arctic Sea Ice Recorded, and Sixth Largest Northern Hemisphere Snow Cover - The culprit in both accounts is warming. The North Atlantic Oscillation has been affected by the Arctic Oscillation, which has been enhanced by warming. The Arctic is warmer and more energetic. This energy is transferred to the jet stream. The energized jet stream pushes Arctic storms further south. Because the storms are warmer than usual, they hold more moisture. Some of the scientists are not convinced completely and say we need to wait before we know for sure. see here From the discussion below, we see that the last time we had weather anywhere close to this extreme was 1961 when we had four Cat 3 storms in a one 12-month period. Cat 3 storm, based on the Northeast Snowfall impact scale, it was 1961. In the last 2 winters we have had six (6) count-em - Six Cat 3 storms! Eh, See how conservative these science guys are?
From the press release: "This winter and last, New York City experienced its two snowiest months on record—February 2010 (36.9 inches) and January 2011 (36 inches)—and Philadelphia experienced four of the top 10 snowstorms in its history. In the Midwest, Chicago was hit by its third biggest snowstorm on record early this February and Minnesota, South Dakota and North Dakota all have suffered through near-record snows this winter. While sections of the United States have experienced stretches of unusually cold weather this winter, temperatures have not been significantly below average. That, too, provides an explanation for the heavy snowfalls."
Remember, the opposite of "it can be too cold to snow" is " the warmer it is the worse the snowstorms are going to be until it gets so warm that it doesn't snow any longer."
Union of Concerned Scientists: http://www.ucsusa.org/news/press_release/climate-change-makes-snowstorms-more-likely-0506.html
National Snow and ice Data Center: http://nsidc.org/arcticseaicenews/index.html
March 2, 2011 Major Decreases in Growth of Alaskan Boreal Forest - Small Increase in Growth of Marginal Forests to the North Along the Edge of the Tundra - One of the interesting things that this study has discovered is that decreased growth rates due to drought stress is not necessarily related to soil moisture. Forests with normal soil moisture can experience drought stress from excessive heat. It's like their vascular system evolved without excessive heat and therefore the capacity of the trees vascular systems to transport water is limited. When the water demand from heat goes above a certain level, trees are stressed because they just can not get enough water fast enough.
From the Press Release: University of Alaska Fairbanks researchers are among collaborators on the study, which compared tree-ring data to satellite images. The study found that tree growth declined across most of the current area of Alaska boreal forest but increased in a smaller area on the cold margins of the forest. “This is one of the first extensive analyses of annual growth and climate response of black spruce in Alaska,” said Glenn Juday, professor of forest ecology at the University of Alaska Fairbanks and a co-author of the article. Scientists at the Woods Hole Research Center and three other institutions based in Alaska and France conducted the study. UAF scientists were instrumental in the project, which involved one of the largest and most widely distributed samples of tree-ring data ever analyzed in Alaska: 839 trees, including 627 white spruce from 46 stands and 212 black spruce from 42 stands. “The tree rings tell us for sure what’s happening on the ground, and the satellite data covers the whole region,” said Juday. “Recent temperature increases have reduced tree growth over most of central Alaska, and increased growth in places where the temperature used to be too low for optimum growth, such as the Western Alaska tundra margin. Summer temperatures in central Interior Alaska are now almost too warm for white spruce to survive.” The study is the first time the two sets of data were compared, Juday said. “Every tree ring sample was compared to the satellite data and they mostly agreed. It’s particularly impressive that the tree ring and satellite data agree so well. This gives the final piece of assurance that this is real.” According to lead author Pieter Beck, a postdoctoral fellow at Woods Hole Research Center, the results offer evidence of the biome shifting in response to climate change and indicate that some ecosystem models may be missing changes happening in the circumpolar region. “While the findings contrast with some recent model predictions of increased high latitude vegetation productivity, they are consistent with longer-term projections of global vegetation models,” Beck said. Scott Goetz, a senior scientist at WHRC, proposed the study and co-authored the manuscript. “Most people don’t think of high-latitudes forests as being drought stressed and they are not, in the traditional sense of having soils dry up and blow away, but their growth is negatively impacted by hot dry air masses and those have increased in recent years,” he said. “This paper shows those drought impacts are captured in both the satellite and the tree ring record.”
Press Release University of Alaska: http://www.uafnews.com/headlines/study-illustrates-shifting-boreal-forest-ecosystem-in-alaska
Article: http://onlinelibrary.wiley.com/doi/10.1111/j.1461-0248.2011.01598.x/pdf
February 23, 2011 Alaskan Forests Have Changed to Greenhouse Gas Emissions Source - This is yet another climate change impact happening before it was supposed to - a big one too. Findings from this team led by a biologist at the University of Guelph, Ontario, Canada, and including scientists from the USGS and the US Forest Service tells us that the black spruce forest of Alaska (much of the forested area in Alaska) that once sequestered 20 megatons of carbon dioxide per year, now emits 14.1 megatons of carbon per year which is equal to 52 megatons of carbon dioxide (some of the carbon emitted is methane, not carbon dioxide, but for simplicity sake, carbon dioxide is considered here.)
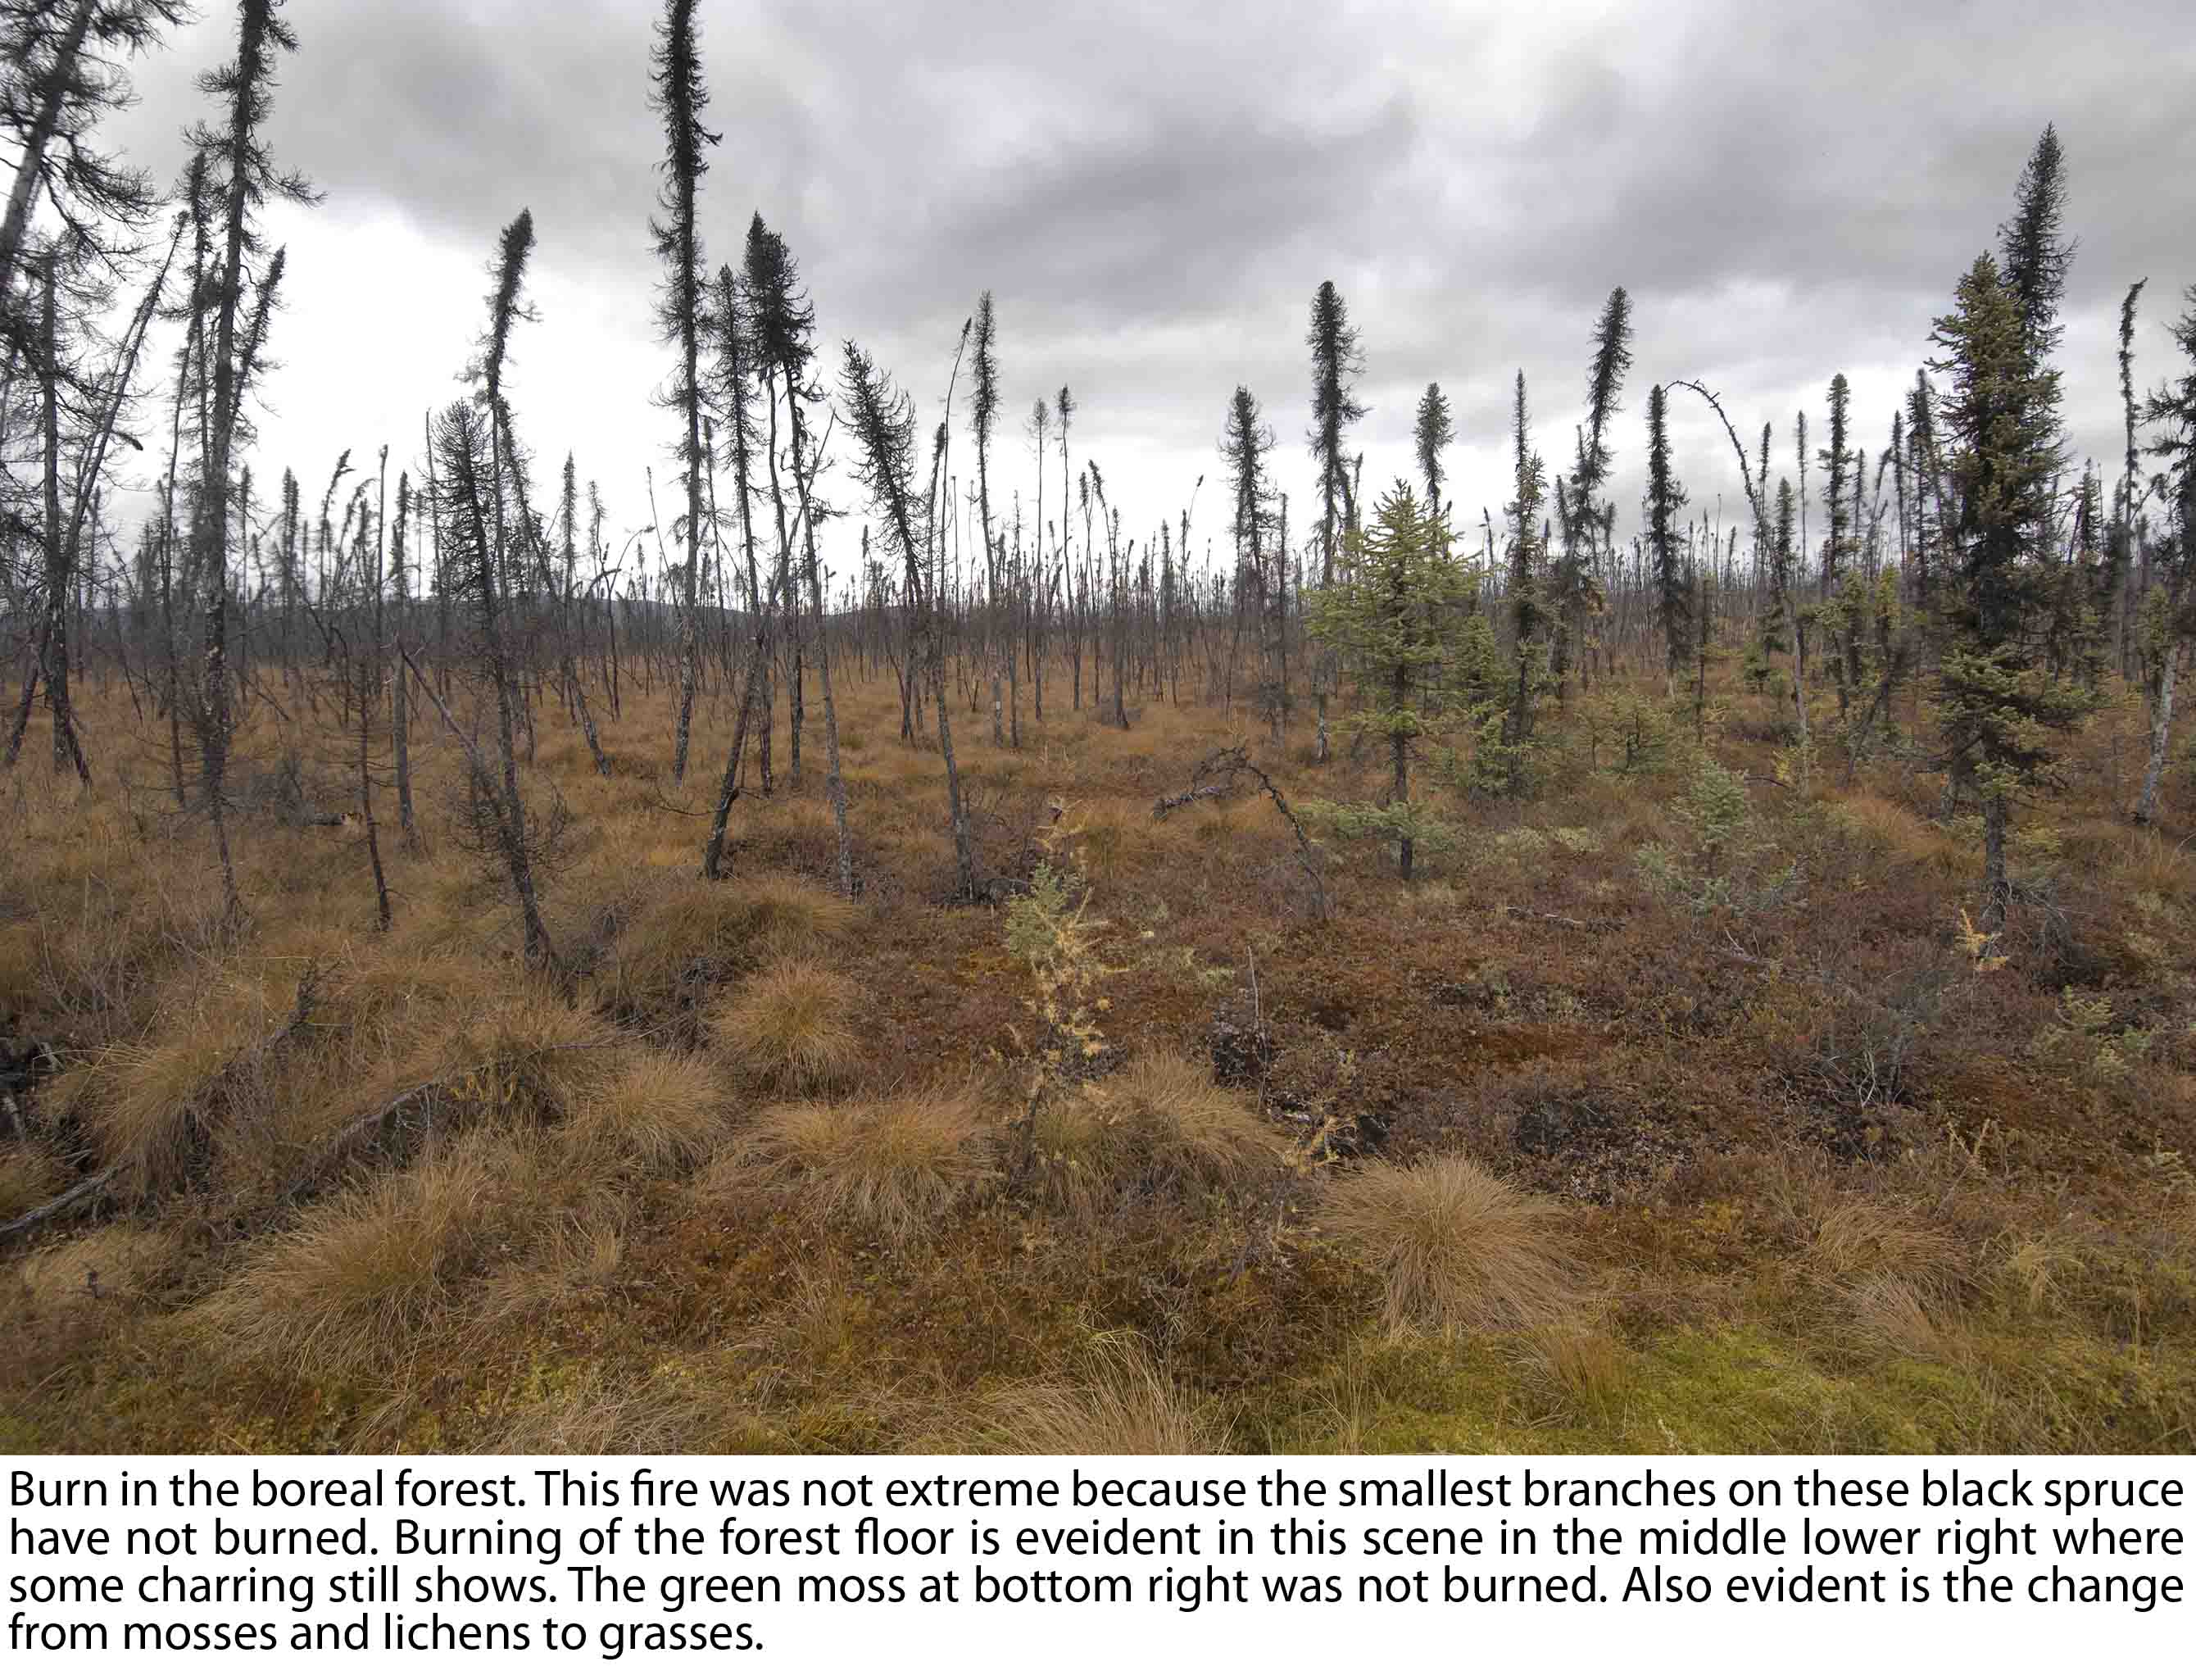 The projection of Alaska's greenhouse gas balance from terrestrial sources, by Zhuang (2007) is a net emissions of 62
megatons of CO2 equivalents per year by 2100. So the findings of this
research shows we are not
quite a hundred years ahead of schedule, maybe 80.
The projection of Alaska's greenhouse gas balance from terrestrial sources, by Zhuang (2007) is a net emissions of 62
megatons of CO2 equivalents per year by 2100. So the findings of this
research shows we are not
quite a hundred years ahead of schedule, maybe 80.
The reason? Forest fires have doubled since the 1960s. Not only this, but large fires have double in frequency as well. Warming is the cause. Warming means drought, even if rainfall is normal, a warmed climate evaporates more - a lot more. More importantly though, its not just the trees that burn and release their carbon back to the atmosphere. The soils are burning too.
Northern forest soils are chock full of carbon. Because of the slow decomposition rate in the north country (ice and snow covered much of the year) organic material decomposes slowly. In addition, a great deal of the northern forest is underlain by permafrost.
Much of permafrost is made of peat. Much of peat is made up of that
wonderful matt of mosses and lichens that grows
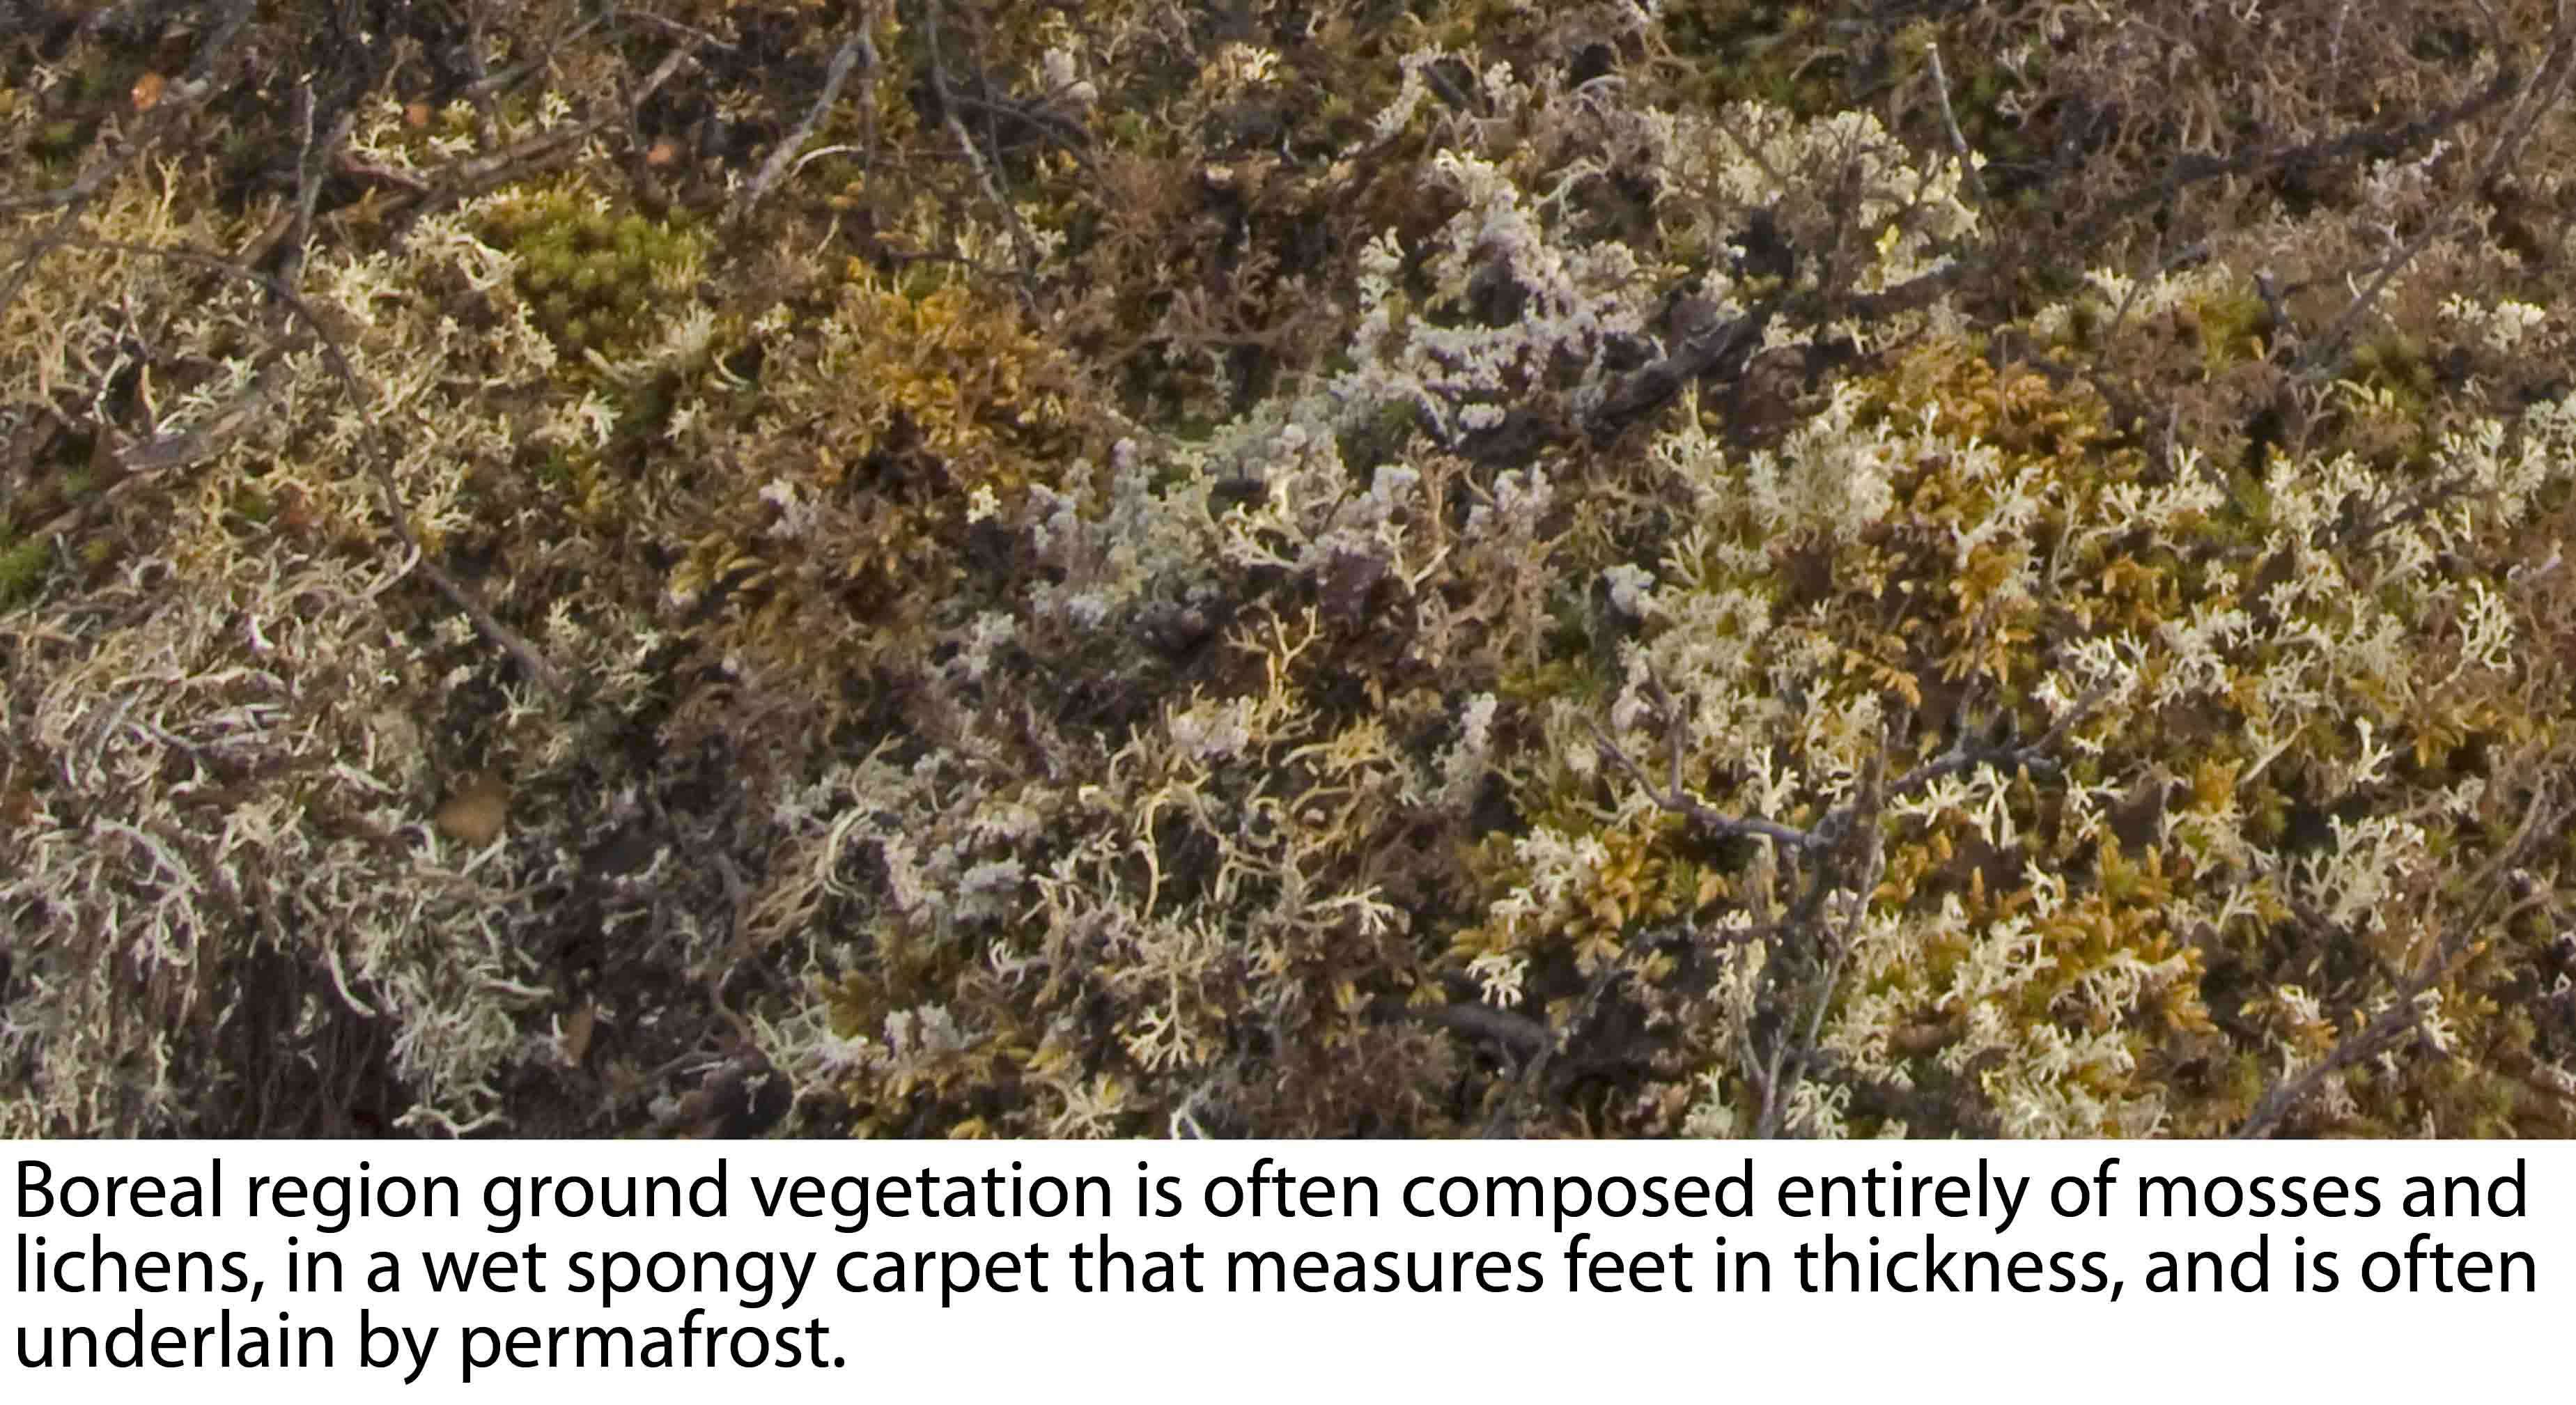 on the ground in the North.
These peats only partially decompose when they die because they become
entombed in ice before the decomposition process can complete.
on the ground in the North.
These peats only partially decompose when they die because they become
entombed in ice before the decomposition process can complete.
So we have several things going on here to cause the north, the great boreal forest, to change from a carbon sink to a carbon source - and a big carbon source at that: more fires burning more trees, more trees burned up and not sequestering carbon, drier soils because of warming, more large fires, and more large fires burning deep into carbon rich peat soils that are no longer entombed in ice because the permafrost has melted.
Now the biggest thing going here is that late season fires, that burn deep into peat rich soils because late in the season those soils are at their driest, have increased four fold since the 1960s.
All told, this 52 megatons of carbon dioxide released by Alaska's boreal forests annually is even greater than the emissions of 40 million acres of beetle killed pine in British Colombia.
Alaska's CO2 emissions from increased forest fires due to climate warming is about equal to all of the emissions from all of Canada's forest fires during the period 1959-1999.
These findings are extremely troubling because Alaska's boreal forest includes less than 10 percent of the world's boreal forest and there is no reason to believe that the rest of the world's boreal forests are not behaving any differently than Alaska's.
Turetsky, et.al., Recent acceleration of biomass burning and carbon losses in Alaskan forests and peatlands, Nature Geosciences, December 2010. http://www.geog.umd.edu/news/turetsky_nature_geo_2010.pdf
Kasischke and Turetsky, Recent changes in the fire regime across the NA boreal region - spatial and temporal patterns of burning across Canada and Alaska, Geophysical Research Letters, May 2006. http://www.uoguelph.ca/~mrtlab/mrtlab/Publications_files/Kas%20Tur%20GRL%202006.pdf
Zhuang et. al., Net Emissions of CH4 and CO2 in Alaska - Implications for the regions greenhouse gas budget, Ecological Applications, Volume 17, 2007. http://www.lter.uaf.edu/dev2009/pdf/1037_Zhuang_Melillo_2007.pdf
Kurz et. al.,Mountain pine beetle and forest carbon feedback to climate change Nature April 2008. http://www.macroecology.ca/spatial/kurz.pdf
February 21, 2011 Beyond Dangerous Climate Change: 2 Degrees C is Out of Reach, Now Comes Extremely Dangerous Climate Change - I do not make this stuff up. These are the scientists words, not mine. The title of this review comes directly from the article titled "Beyond Dangerous Climate Change: Emission Scenarios for a New World". It was published in January in the most prestigious academic journal in the U.K., Philosophical Transactions of the Royal Society.
From the Abstract: "The analysis suggests that despite high-level statements to the contrary, there is now little to no chance of maintaining the global mean surface temperature at or below 2 degrees C. Moreover, the impacts associated with 2 degrees C have been revised upwards, sufficiently so that 2 degrees C now more appropriately represents the threshold between ‘dangerous’ and ‘extremely dangerous’ climate change."
The authors draw from a long list of papers that have updated the 2007 IPCC impacts from climate change. Exceeding 2 degrees C now carries with it greater risk of larger impacts. But the authors also make it crystal clear that the latest global agreement, the Copenhagen Accord, bluntly ignores scientific assumptions about the magnitude and speed of climate change associated with cumulative emissions, instead focusing on the more politically palatable "emissions reductions."
This report lays out the concepts of physical science vs. "political" science. I have always been dismayed that climate politicians have so publicly, in total neglect of the laws of physics, based such a pivotal decision making process considering the welfare of mankind on an inadequate, political assumption. This emissions limiting process is so farcical that it is like basing the load bearing capacity of a bridge on how many cars drive over it every day , instead of how heavy the cars are...
Every molecule of greenhouse gas counts in physics, including those already emitted by affluent western societies. To mitigate for climate change requires that those responsible for past emissions mitigate for past emissions. Those who will emit in the future must also mitigate for their emissions regardless of their socio-economic status. Do the more affluent societies owe a debt to those less affluent? Certainly so. We elect our leaders so that they can lead us through issues like this and do the responsible thing.
The long life of CO2 in our atmosphere means that Western societies are very, very, very responsible for climate change. In comparison, annual global emissions are only 2 percent of the total cumulative emissions that remain in our skies since the industrial revolution began. (And btw, because of warming already, CO2 stays in our skies much longer than it did in the 20th century. CO2 now lasts 300 years instead of 100 to 200 years, and 25 percent of CO2 stays in the sky forever.)
Cumulative emissions are what warms Earth, not annual emissions. Well, all emissions warm Earth, but annual emissions are responsible for only a tiny part of the warming - 2 percent per year - get it?. It is what is in our sky right now, what has accumulated over 150 years of emissions, and most importantly, over half of all the CO2 emissions that have occurred in the last 200 years have happened since 1970.
As an example of the weight of cumulative emissions vs. annual emissions, it will take about 70 years for China to catch up with the cumulative emissions of the United States, if the U.S. limits their emissions to 2000 levels and China grows at 3 percent per year for the next 20 years before leveling off with their emissions. China is the second ranked greenhouse gas emitter in world based on total emissions since 1870. The U.S. has emitted nearly three times more CO2 than the second ranked country (China.)
This is the burden of the United States, but the other Western nations are significantly responsible as well, compared to developing nations. Hiding behind emissions mitigation, and not acknowledging cumulative greenhouse gas emissions physics shows the ultimate disrespect for science, and now, because this mistreatment of reality is so, so big, it has virtually condemned this planet to experiencing Dangerous ... er ... make that Extremely Dangerous Climate Change.
2 Degrees C: Authors say "Slim Chance" - "Most analysts would agree that the current state of the UNFCCC process and other efforts to reduce greenhouse gases make the chances of keeping below 2 degrees C extremely slim", their words, not mine. (New et. al., 2011) Why? Economic Prosperity. The big boys at Copenhagen, the IPCC, the Stern Review, etc. all take into consideration that emissions reductions of no more than 3 to 4 percent per year are essential if economic growth is to continue. None of the "business as usual" political / science organizations consider sustainable pathways.
Our planet's systems are grinding to a halt with the reality of planetary physics destroying existing subcontinental scale ecosystems, and we as a society continue to press for growth.
Anderson and Bows, Beyond dangerous climate change - emission scenarios for a new world, Philosophical Transactions of the Royal Society, January14, 2011. http://rsta.royalsocietypublishing.org/content/369/1934/20.full.pdf+html
New et. al., Four degrees and beyond, the potential for a global temperature increase of four degrees and its implications, Philosophical Trans. R Soc. January 13 2011. http://rsta.royalsocietypublishing.org/content/369/1934/6.full.pdf+html
February 10, 2010 Record Low Arctic Sea Ice and Record Wicked Snowstorms in the Northeastern U.S. - January saw the lowest recorded sea ice extents in the Arctic and a hyperactive jet stream that just kept on pummeling the eastern half of the U.S. with one major winter storm after another. Oddly enough, some of the lowest Arctic sea ice concentrations were seen in areas closest to the U.S. in the Labrador Sea and Davis Strait between Canada and Greenland. Even Hudson Bay did not freeze over completely until mid January. Normal freeze-up is mid-November.
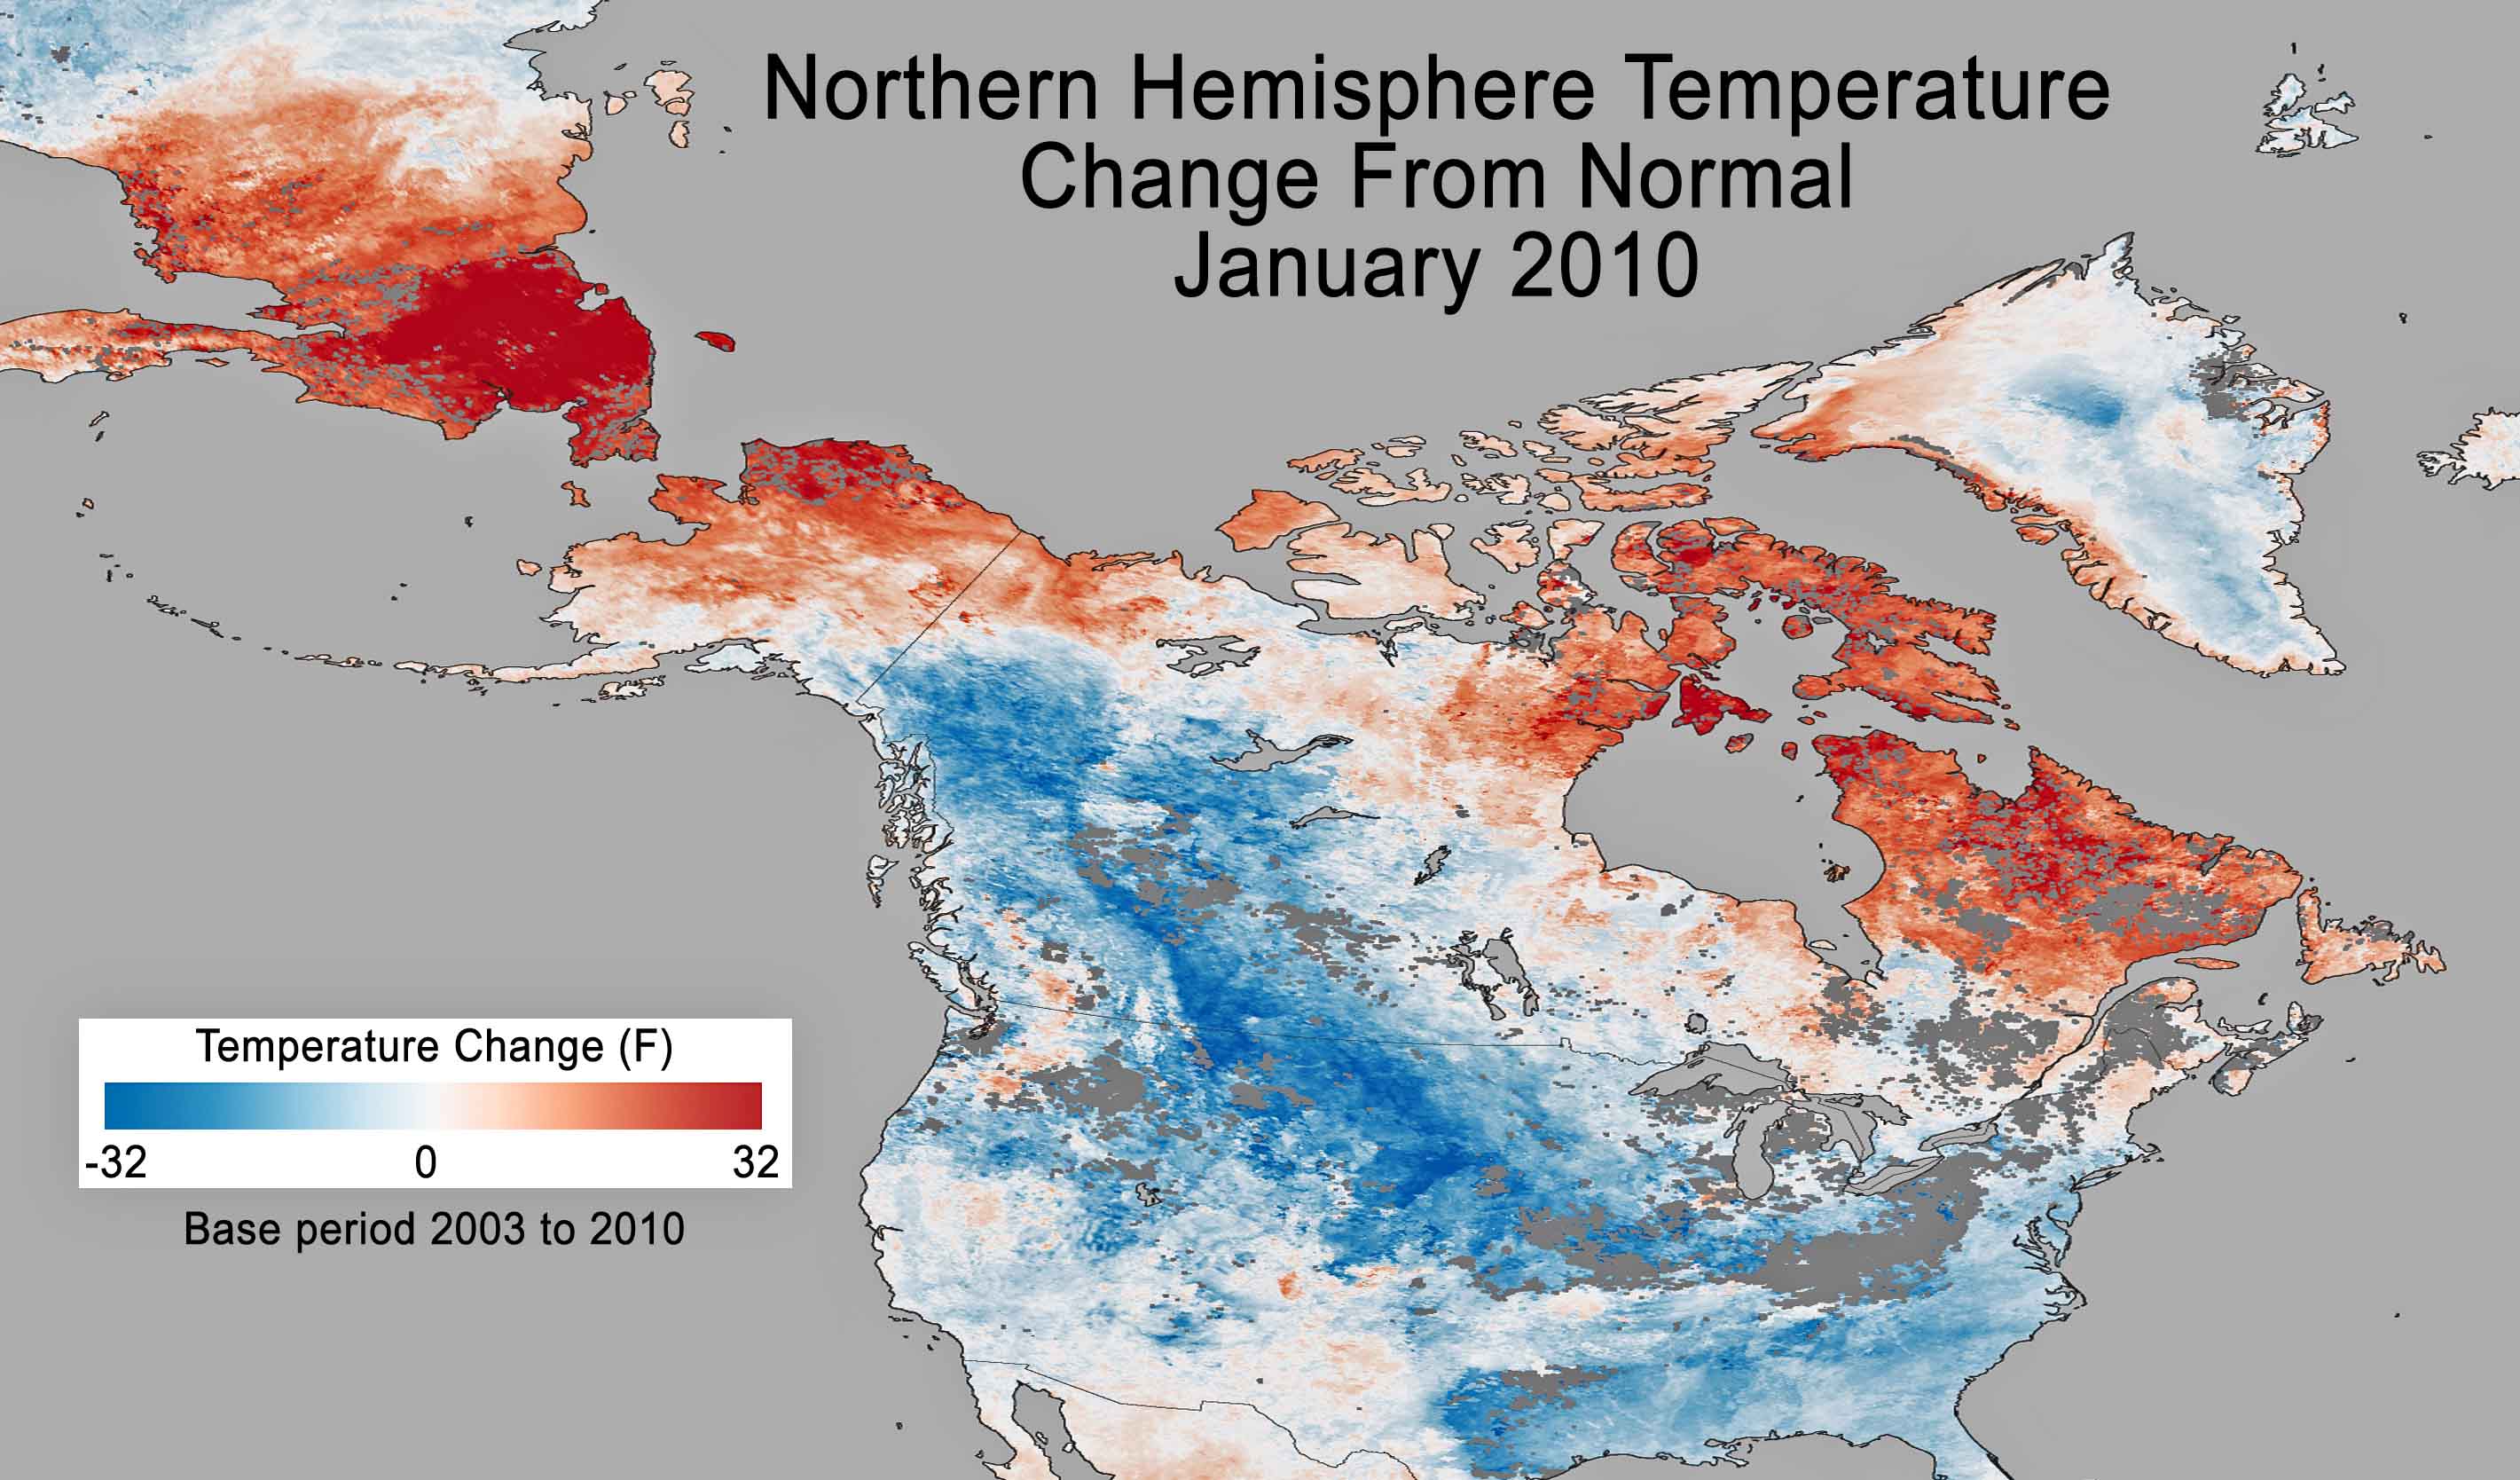
So what is going on? The climate models have been telling us this for decades. The climate scientists have been warning us that winters on a warmer planet, at least for several decades, will produce bigger, meaner snowstorms. The reason is that warmer air holds more moisture, a warmer climate is holds more energy and a warmer Arctic increases the energy in the jet stream. So the warmer Arctic air is more easily pushed south by the enhanced jet stream giving much of the mid latitudes relatively colder weather (warm for the Arctic is still cold by most standards.)
The U.S. had the 5th largest snow cover recorded on January 12, but even so, it was so warm in the Iqaluit Territorial capital of Nunavat in far northern Canada of Iqaluit, the locals had to cancel their New Year’s snowmobile parade.
Counter intuitively, all of that snow made it seem like we were getting a lot of moisture. But generally, 10 inches of snow equals an inch of rain. The U.S. had a very dry January, typical of a La Nina January. Overall it was the 9th driest January in the 117 year record.
With all of that snows, temperatures in the northeast were cool, but a long way from record territory. For the eleven northeast region states, the average January temperature ranked from 26th coldest (West Virginia and Maryland) to 72th coldest (Maine).
Globally, 2010 tied 2005 for the warmest year on record. This leaves the super El Nino year of 1998 now in third place. The 2010 record was even reduced by the La Nina that developed in early last summer.
Northeast Region Climate http://www.nrcc.cornell.edu/page_summaries.html
Arctic Oscillation Chills North America, Warms Arctic: NASA Earth Observatory, http://earthobservatory.nasa.gov/IOTD/view.php?id=48882
Global Statistics: http://lwf.ncdc.noaa.gov/sotc/global/2010/1
February 8, 2011 The End of the Arctic As We Know It - A
study from
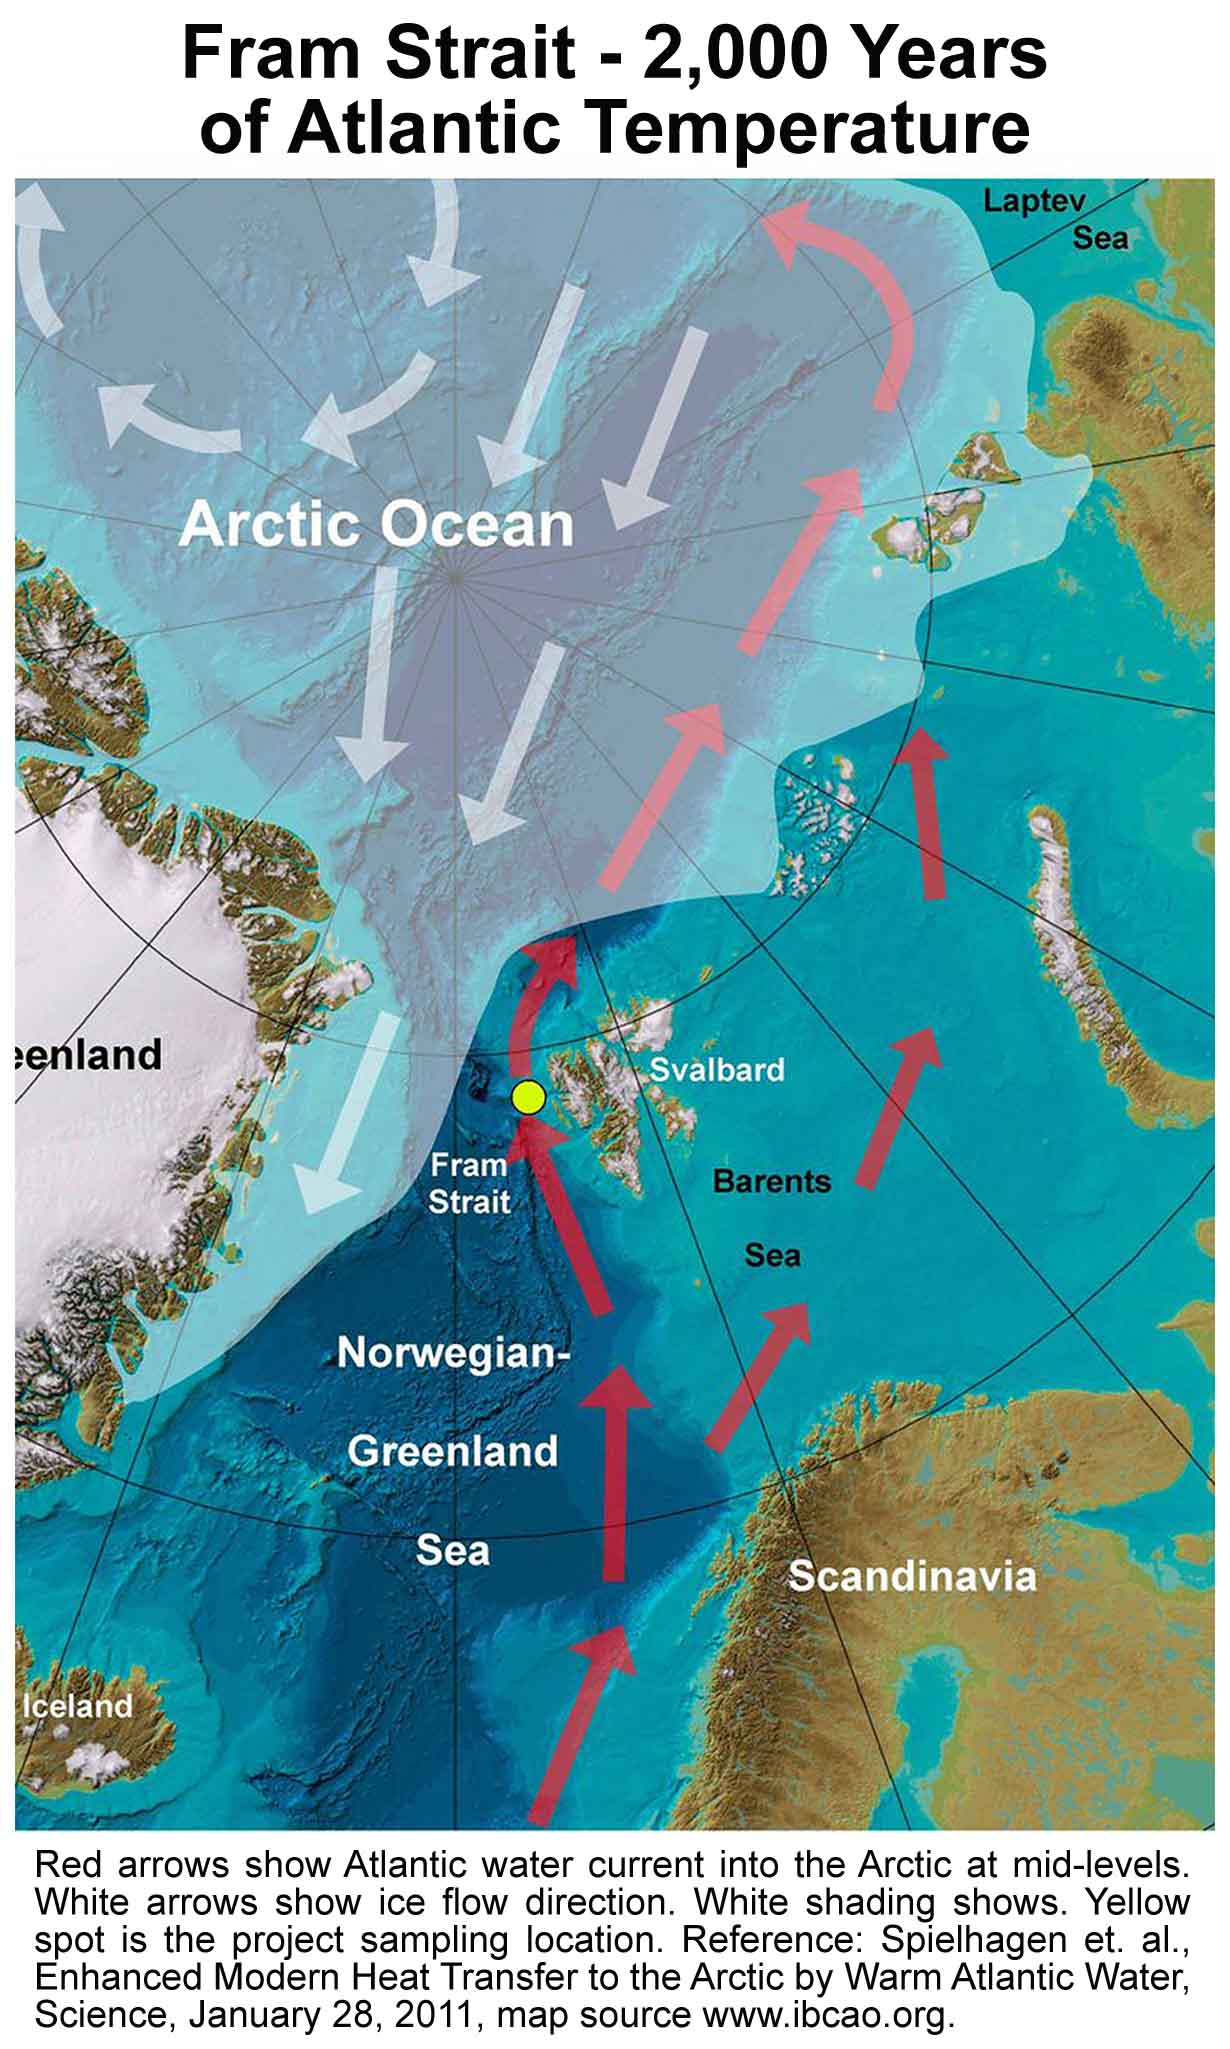 the
Academy of Sciences of Germany, Alfred Wegner Institute of Polar and Marine
Research and the University of Colorado, Boulder has quotes “We find that
early 21st century temperatures of Atlantic Water entering the Arctic Ocean
are unprecedented over the past 2,000 years and are presumably linked to the
Arctic amplification of global warming.”
the
Academy of Sciences of Germany, Alfred Wegner Institute of Polar and Marine
Research and the University of Colorado, Boulder has quotes “We find that
early 21st century temperatures of Atlantic Water entering the Arctic Ocean
are unprecedented over the past 2,000 years and are presumably linked to the
Arctic amplification of global warming.”
There has been a definite shift of currents in the Fram Strait. This is not likely just a temporary shift where meandering ocean currents move back and forth in an aimlessly random pattern. This shift has appeared to happen once in 2,000 years, sometime in the last decade. The date can not be pinned down any closer than a couple of decades because of what is called bio-perturbation.
Any kind of perturbation is not likely to be a good thing, and bio-perturbation is not a good thing for “seeing” high resolution in an ocean sediment core. Worms are the cause of this perturbation. They move through the top most accumulating ocean sediments eating up the organic material and mix the sediments as they go. This action only messes up the sediments a little bit so that annual layering is generally missing. The signal that lies in longer time frames is still intact though so science can unlock the history of the area for all to see.
Speilhagen and his team looked at tiny plankton shells of a class of plankton called foraminifera (forams.) Prior to 1900, 10 to 40% of all planktonic forams belong to subpolar species. Subpolar species are exclusively those plankton that are not of a "polar "origin. In other words, on 10 to 40 percent of the water, where the plankton grew, that were deposited as sediment at this research teams coring site. The scientists can tell this because the plankton absorb a particular type of nitrogen that can be traced back to it's point of origin. Sub polar waters have a different kind of nitrogen than does polar waters.
The telling results from this research come from the last 100 years of
sediment. When the researchers finished their chemical analysis it was clear
that something had changed. The last 100 years however show a drastic
change in the origin of the plankton. Sixty-six percent of these plankton
now come from sub polar waters. The authors say that this change
represents an "... unprecedented inversion subpolar foraminifer ... in
samples from the Modern Period indicate a strongly increased influence of
warm Atlantic waters [coming] from the Norwegian Sea."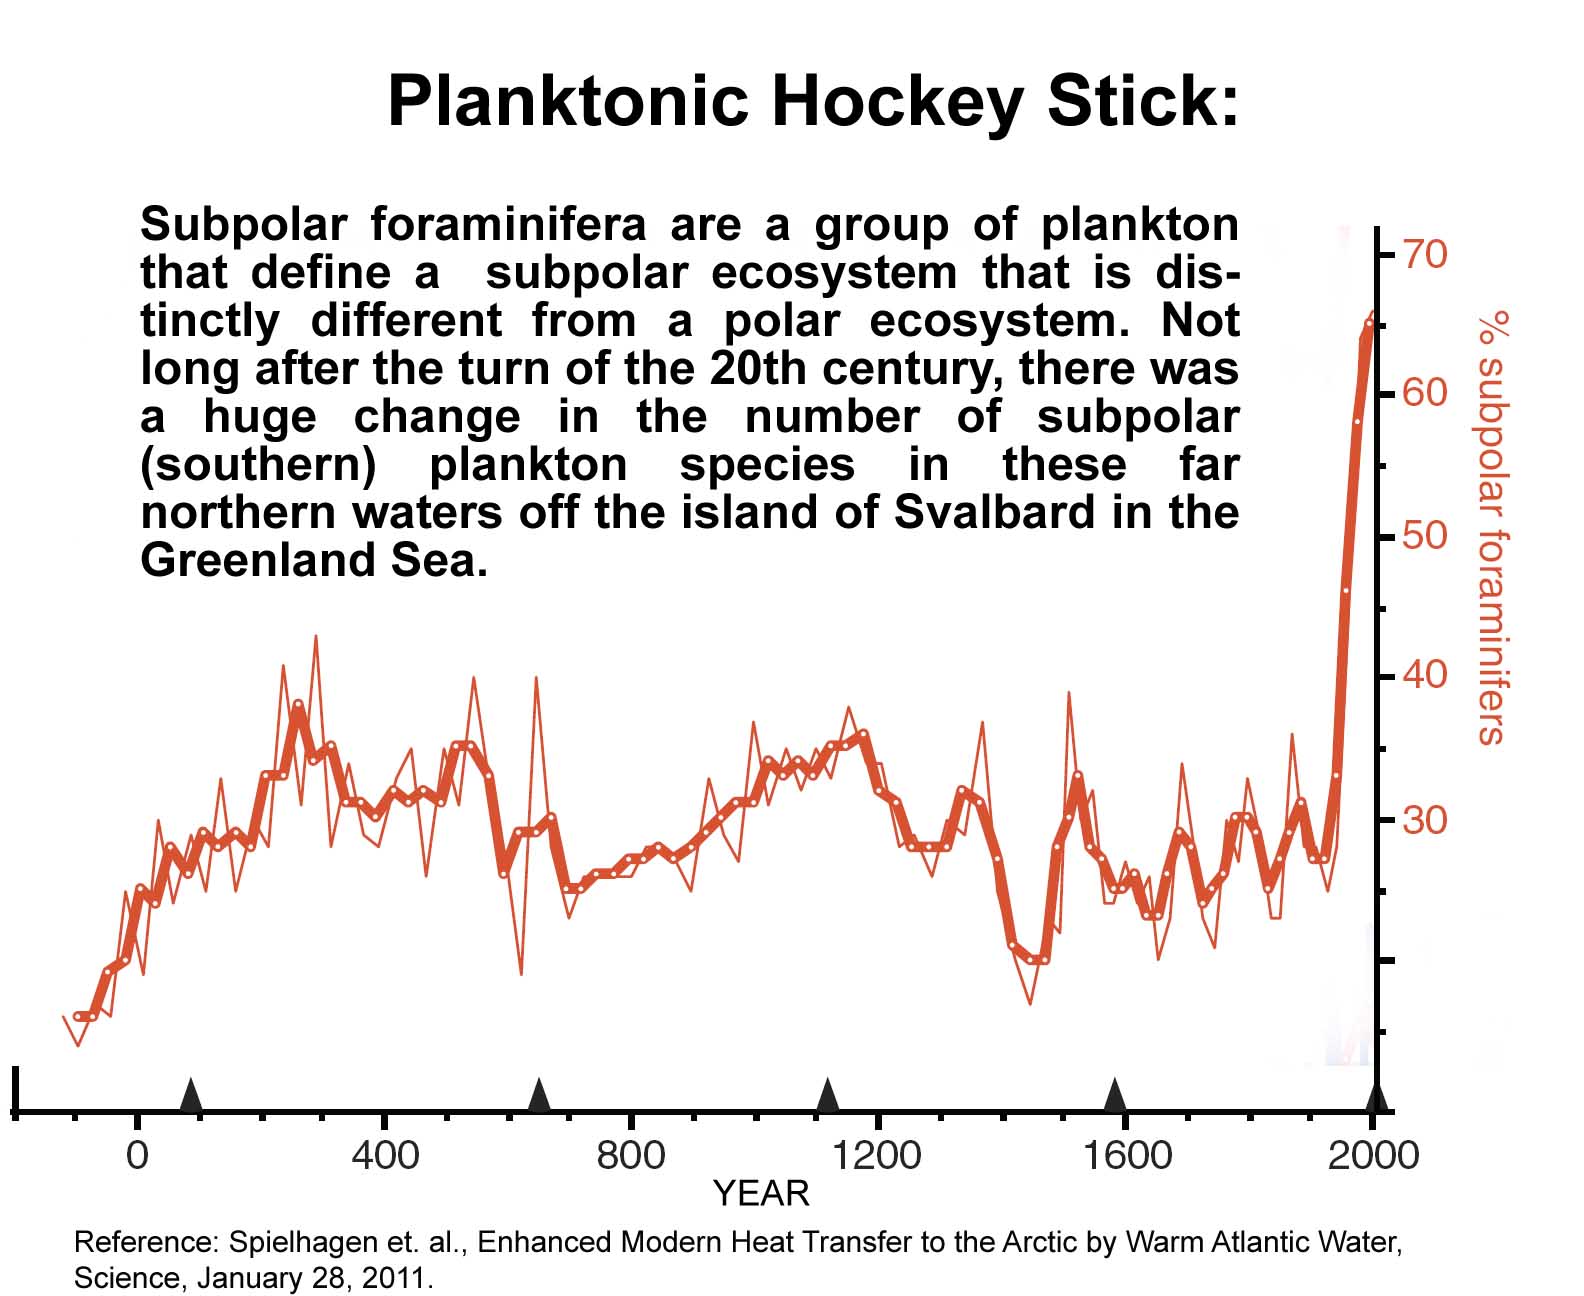
Spielhagen et. al., Enhanced Modern Heat Transfer to the Arctic by Warm Atlantic Water, Science, January 28, 2011. (Abstract)
http://www.sciencemag.org/content/331/6016/450.short
Press Release University of Colorado, Boulder http://www.colorado.edu/news/r/9059018f4606597f20dc4965fa9c9104.html
Popular article with links: http://www.zeeburgnieuws.nl/nieuws/mb_arctic_melt.html
Climate News: http://www.zeeburgnieuws.nl/nieuws/mb_arctic_melt.html
February 5, 2011 China's CO2 Emissions Surge Far Ahead of the U.S. - The 2009 data have been crunched at the U.S. Energy Information Agency. They have tallied the world's CO2 emissions for us. You can see the raw data at the link below. U.S emissions have fallen 10 percent during the recession, China's emissions, after being ranked number 2 behind the U.S. in 2006, are now 42% higher than U.S. emissions.
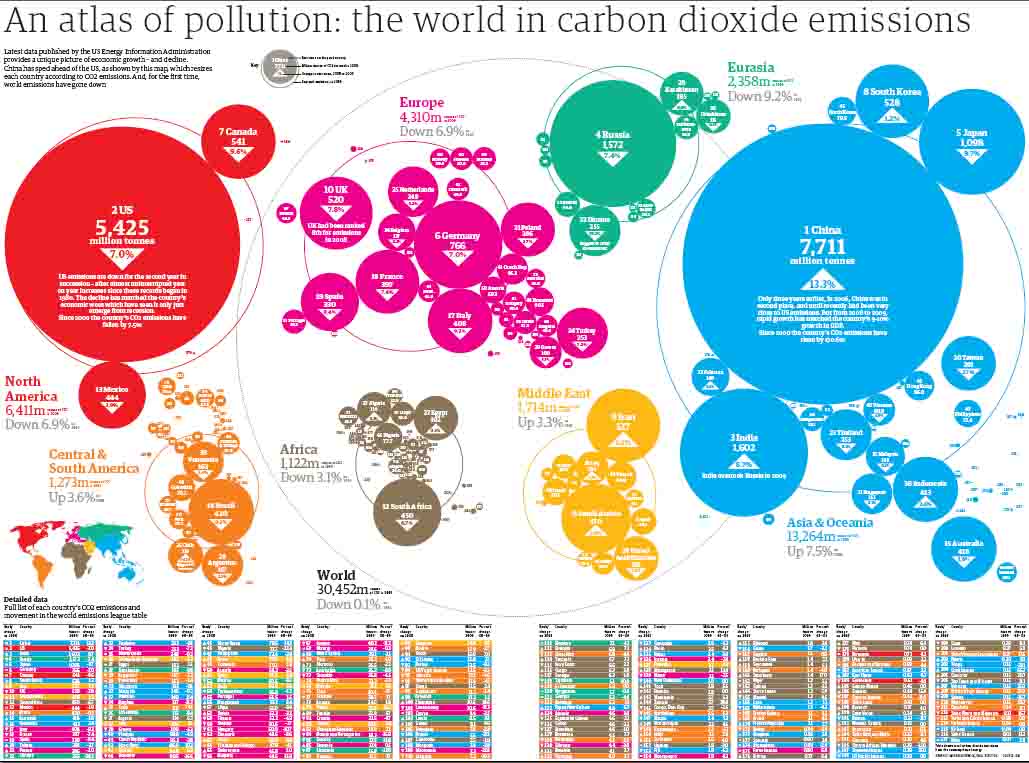
Click on the graphic to enlarge.
Guardian (U.K.) Carbon Web http://image.guardian.co.uk/sys-files/Guardian/documents/2011/01/28/CarbonWeb.pdf
U.S. EIA 2009 global CO2 emission data ranked per country: http://tonto.eia.doe.gov/cfapps/ipdbproject/IEDIndex3.cfm?tid=90&pid=44&aid=8
February 4, 2011 Abrupt Climate Change in the Amazon Now: The Amazon is No Longer Absorbing Carbon Dioxide - In 2005, the Amazon had a one-hundred year drought. An event like this is basically supposed to be once in a hundred-year occurrence. Five years later they had another. But the 2010 drought was likely more than half again as extreme as the 2005 drought.
We can not say with scientific certainty that because we have had these two rare events in such close proximity that it is because of climate change. But a scientific certainty is something different from a moral or ethical certainty. Because there is no statistically valid answer for a data set with two points, does not mean that the assumption is false.
What has been projected in the models is happening now. Drought is rapidly increasing in the Amazon. The rain forest is dying off. As the dead trees decay, they are emitting more greenhouse gases than the remaining live ones absorb. The 2005 event alone was devastating to the Amazon forest. But the death of trees is just the beginning. What does this mean for the critical climate control system that is the Amazon rain forest? You know, the one that sequesters so much CO2 that it is indispensible?
The greenhouse gas emissions from the Amazon now, all of the Amazon - every year - are equivalent to about 13 billion tons of carbon dioxide. This is more than twice the greenhouse gases that the United States emits every year.
The authors this paper in the journal Science say: "Having two events of this magnitude in such close succession is extremely unusual, but is unfortunately consistent with those climate models that project a grim future for Amazonia." They go on to talk about the likelihood that the 2010 drought was enhanced by the 2005 drought because trees were still stressed and may have succumbed more easily. Yes, stills stressed from the 2005 drought.
What happens in a tree-killing drought such as the 2005 event is that dry soils kill the root hairs on tree roots first. This destroys the trees ability to soak up water and if severe enough, the tree dies. It can take a decade for trees to regrow their root hairs. The least amount of stress can push them over the threshold and they die, years after the original drought, because of damage sustained during the original drought.
Dr. Lewis at Leeds university in the UK told me that the forest will regain it's status as a carbon sink in a decade if another big drought does not happen during this time, and that the likelihood of more and bigger droughts is of course predicted to happen.
But I think that the really important thing to consider here is the philosophical road we as a society need to follow. Are we going to wait on the science, or make judgments on a multitude of events occurring faster and with more severity, that have been projected to happen on a warmer planet? Are we going to sit idly by while vested interest continue to claim their scanty publications prove there is doubt, or are we going to
They also tell us that their analysis does not consider forest fires caused by the drought conditions. And for context, the United States emitted 5.8 billion tons of greenhouse gases in 2007 (World Resources Institute).
In an article in the U.K. Guardian, Lewis is quoted as saying the number of trees that died in the 2010 drought alone "in the low billions of trees."
These researchers from the University of Leeds in the UKL estimate that the 2010 drought will be responsible for 8 billion tons of greenhouse gases. The Amazon biosystem normally sequesters 1.5 billion tons per year. Along with the 2005 drought, the Amazon forest was responsible 13 billion tones of emissions, or will be over the next dozen or so years as the trees decay. This 13 billion tons of greenhouse gases are almost a decade's worth of sequestration from one of the largest single sinks in the world. Thirteen billion tons is 42 percent of mankind's annual global CO2 emissions.
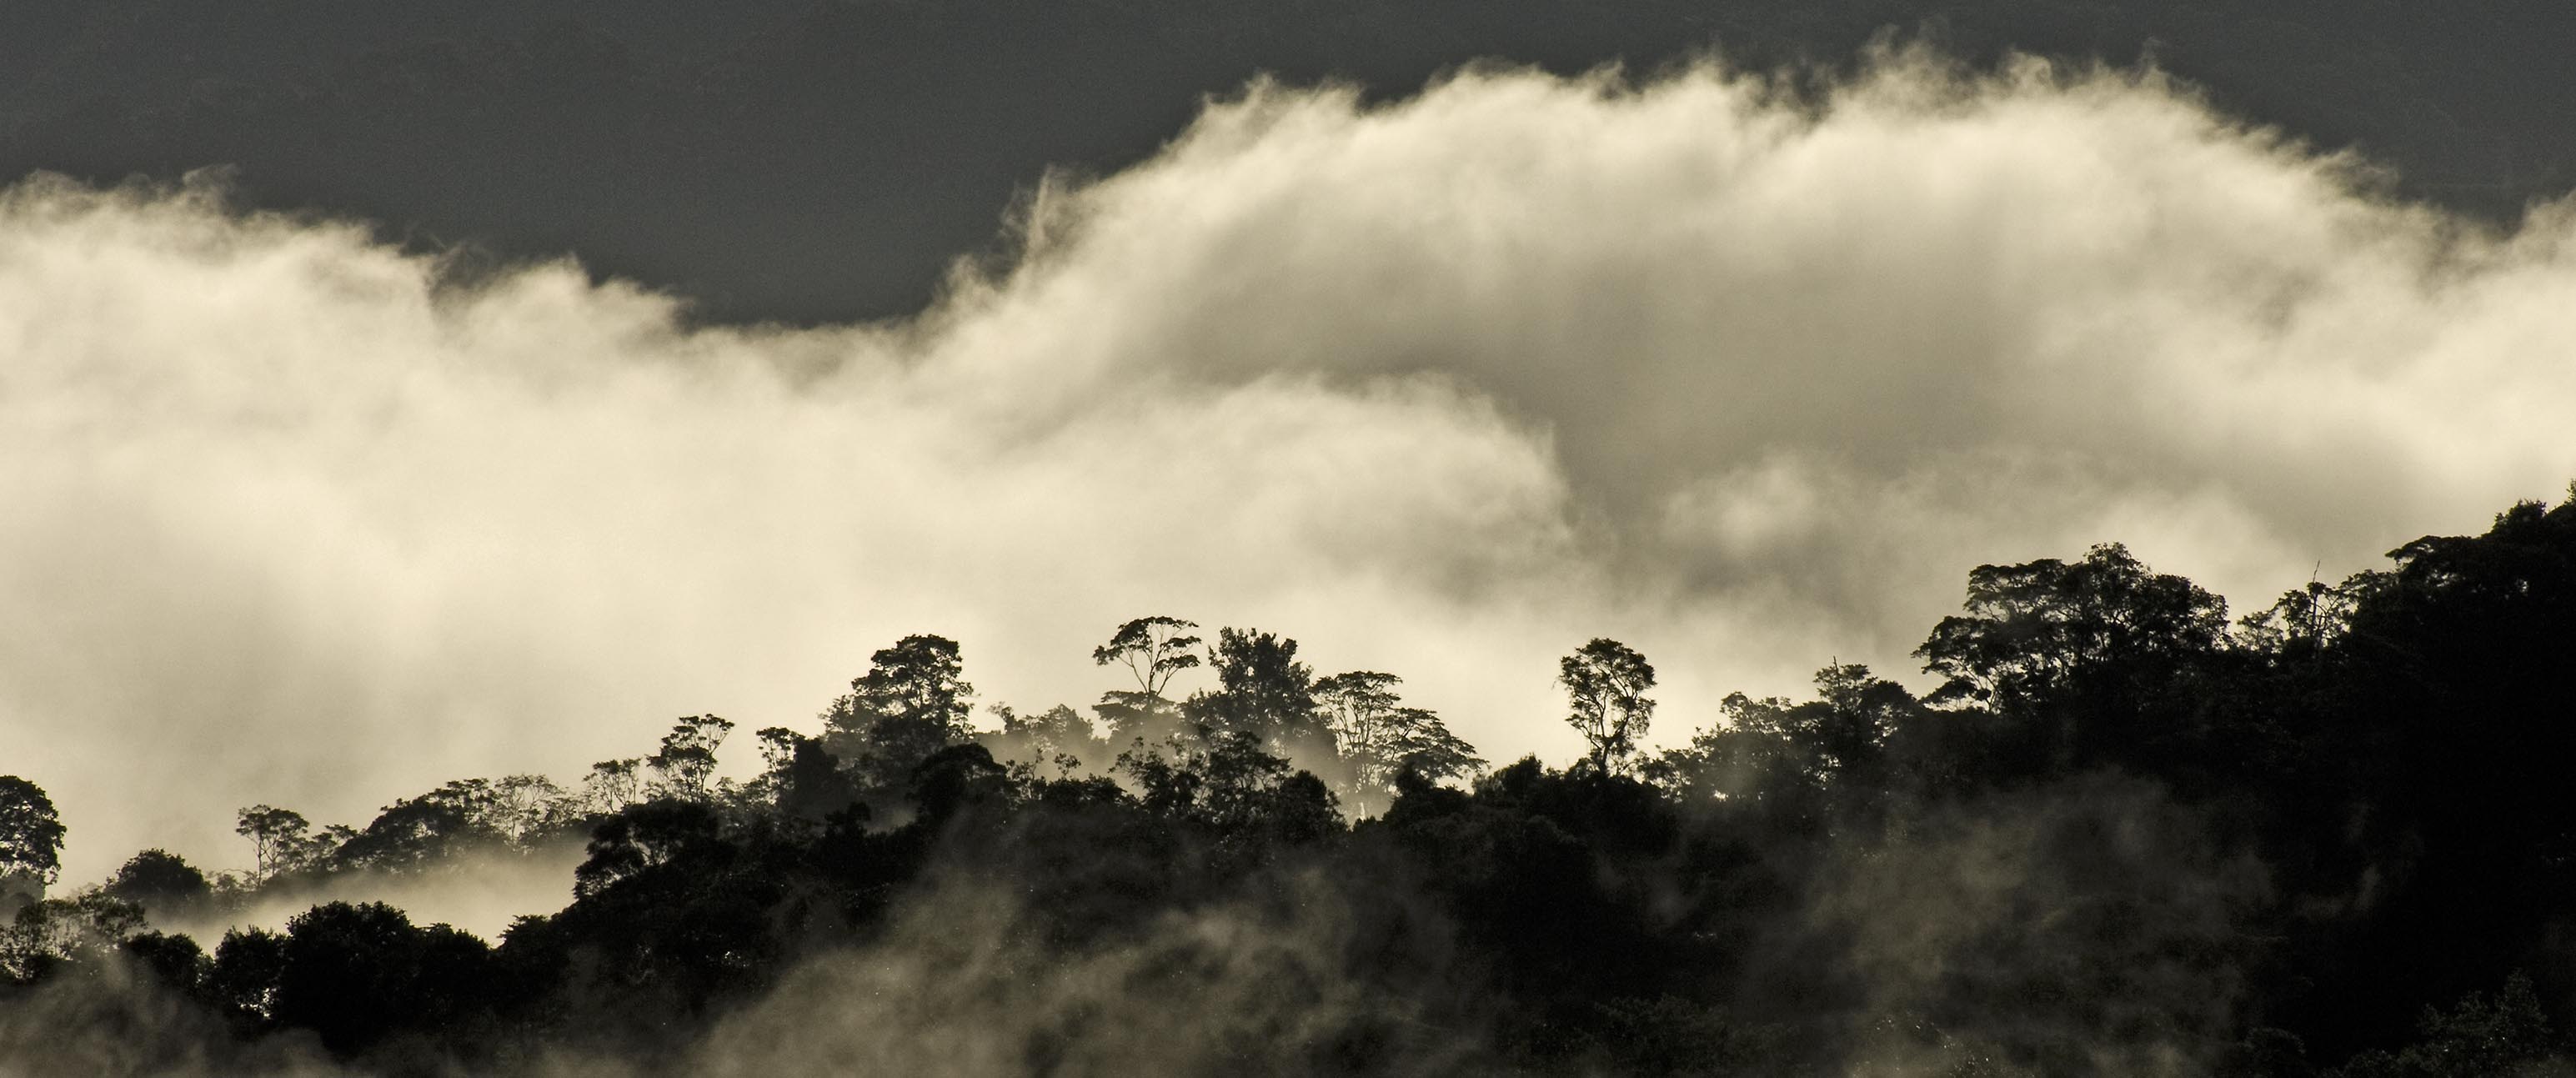
FYI Amazongate - From our friends the climate deniers: Dr. Lewis was responsible for the science referred to by the IPCC in the so-called Amazongate affair. The Guardian in the United Kingdom accused the IPCC of referencing a World Wildlife Foundation (WWF) report saying that 40% of the Amazon could be impacted by climate change. The insinuation here is that the WWF report was not a peer reviewed scholarly source. Well, it seems that the WWF, in the paper referenced by the IPCC, had referenced Dr. Lewis's work appropriately. The references is valid, the IPCC committed a Scribner's error. The world has lost confidence in climate science because of climate denier fraud. Every single climategate controversy has been cleared, but vindication by multiple boards of inquiry does not make the evening news like a fast breaking climate scandal.
The 2010 Amazon Drought by Simon L Lewis, Paulo M Brando, Oliver L Phillips, Geertje MF van der Heijden and Daniel Nepstad is published in the journal Science on Friday 4 February 2011 http://www.sciencemag.org/content/331/6017/554.abstract . Press Release: http://www.leeds.ac.uk/news/article/1466/
Guardian Article http://www.guardian.co.uk/environment/2011/feb/03/tree-deaths-amazon-climate
Phillips, O. L. et al. Drought Sensitivity of the Amazon Rainforest, Science 323, 1344-1347 (2009).
Marengo, J. A., et al., The Drought of Amazonia in 2005, Journal of Climate, 21, 495-516.
February 1, 2011 Antarctica is Still Warming - A paper by Stieg et. al. in 2009, widely accepted as the best in Antarctic temperature analysis in recent history, has recently come under fire from a paper by O'Donnell, et. al. O'Donnell's paper says that warming in Antarctica is only half of what Stieg says. The denialists are wild with glee. Another warmist has been slain.
Unless, of course, O'Donnell is wrong, which Steig says is true, but Steig also says O'Donnell makes some good point. Steig's critique of the O'Donnell paper can be found on Realclimate.org. The denier's critiques can be found on a denier's site near you along with personal attacks and other unscientific behavior.
What Steig says is that O'Donnell is wrong about West Antarctica, which is where the largest disagreement in the two papers is found. Everywhere else, it's just a question of "how much warming". Both papers say that Antarctica is warming. Antarctica, according to the 2001 IPCC Report, was not supposed to start losing ice until the end of the century. that it is warming now - at all - is the important thing. The reason we are even having this discussion is that Antarctica is a very sparse place when it comes to finding temperature.
The O'Donnell paper says West Antarctica is not warming. They also through out half the data from West Antarctica (the Byrd Station), and what they threw out is where the warming is. What about the other stations in West Antarctica? There are none. O'Donnell has also used a model that has a history of underestimating. So to find that O'Donnell's results are less than a model that historically does not underestimate is not new, it's propaganda.
The Realclimate.org post ends "In summary, even if their results are taken at face value, O’Donnell et al. 2010 doesn’t change any of the conclusions reached in Steig et al. In West Antarctica where there is disagreement, Steig et al, 2009 is in better agreement with independent data, and O’Donnell et al.’s results appear to be adversely affected by using procedures known to underestimate trends. Thus while their results may represent an improved estimate for the trends in data rich regions — East Antarctica and the Peninsula — it is virtually certain that they are an underestimate for West Antarctica. This probably means going back to the drawing board to write up another paper, taking into account those suggestions of O’Donnell et al. that are valid, but hopefully avoiding their mistakes."
Realclimate.org - http://www.realclimate.org/index.php/archives/2011/02/west-antarctica-still-warming-2/
O'Donnell - http://journals.ametsoc.org/doi/abs/10.1175/2010JCLI3656.1
Steig - http://www.nature.com/nature/journal/v457/n7228/covers/
January 27, 2011 Atlantic Water Entering Arctic Ocean 2 degrees C Warmer Than the Last 2,000 Years - "Enhanced Modern Heat Transfer to the Arctic by Warm Atlantic Water", Science, (abstract) The Arctic is responding more rapidly to global warming than most other areas on our planet. Northward-flowing Atlantic Water is the major means of heat advection toward the Arctic and strongly affects the sea ice distribution. Records of its natural variability are critical for the understanding of feedback mechanisms and the future of the Arctic climate system, but continuous historical records reach back only ~150 years. Here, we present a multidecadal-scale record of ocean temperature variations during the past 2000 years, derived from marine sediments off Western Svalbard (79°N). We find that early–21st-century temperatures of Atlantic Water entering the Arctic Ocean are unprecedented over the past 2000 years and are presumably linked to the Arctic amplification of global warming.
http://www.sciencemag.org/content/331/6016/450
January 23, 2011 Climate Change Caused Extinction of Pika Colonies
(from Nature Climate)
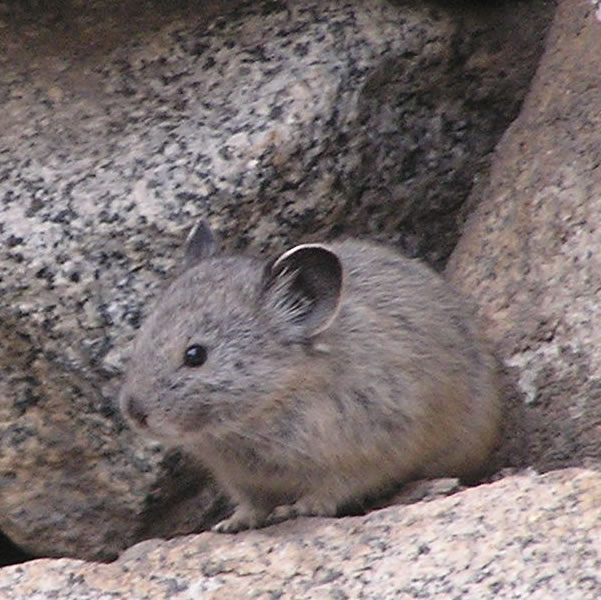 This
little guy is one of my (and my wife's) favorite animals on the planet. It
lives in alpine scree or talus slopes - giant rock piles created as craggy
mountains disintegrate over eons. These rock piles are devoid of trees and
have scanty alpine vegetation (arctic tundra basically) in patches where a
little dirt has accumulated.
This
little guy is one of my (and my wife's) favorite animals on the planet. It
lives in alpine scree or talus slopes - giant rock piles created as craggy
mountains disintegrate over eons. These rock piles are devoid of trees and
have scanty alpine vegetation (arctic tundra basically) in patches where a
little dirt has accumulated.
The pika is a baby rabbit sized rodent with the industriousness of Henry Ford assembly line. They work tirelessly through the fleeting alpine summer to gather enough "pika hay" to last them through the winter. Their Pika hay" is nothing more than grass and those abundant and hardy high altitude alpine wildflowers that are common above treeline. They store their hay in the crevasses of the rock piles - between the millions of rocks that they call home.
One of my favorite memories of these cute little creatures was from my honeymoon. My wife and I were married in Teton National Park, on the banks of the Snake river outside of Jackson by the local justice of the peace who was the spitting image of a young John Denver. We backpacked in the Tetons' for our honeymoon, first crossing Jenny lake at the foot of the mountains in one of the old reliable shuttle boats that takes hikers to the automobile inaccessible trailhead.
Our stay in the high Tetons was brief but nothing short of spectacular. We camped in an alpine meadow, surrounded buy what are undoubtedly the most picturesque mountains in the lower Rockies. As the sun was striking our tent that first morning of our new marriage, we were awakened by the persistent pyeew.... pyeew... of the pika's call. One of these little furballs was especially close to the tent and we rejoiced at our good fortune.
The call of the wilderness was just too great. We knew what awaited. Out into the magnificent mountains we tumbled to be greeted by rock and ice, blue sky and one seriously perturbed pika. It seems we had pitched out tent on it's favorite hay field. The poor little guy admonished us until breakfast was had and camp struck.
The little guys can't stand something associated with the warming. It may be that their "hay" is being replaced by shrubby species now that the climate has moderated, or they succumb to the heat. So they have moved up the mountain where the rock fields and scree allow, or simply disappeared in other places.
Repeated attempts to get the pika listed as endangered have failed. http://www.biologicaldiversity.org/species/mammals/American_pika/
From Nature Climate: Rising temperatures may be to blame for the disappearance of a mountain-dwelling mammal. Recent climate change in the American West has substantially increased the rate of local extinctions of one small, mountain-dwelling mammal and has spurred surviving populations to move to cooler spots upslope, a study suggests. Erik Beever, an ecologist formerly at the University of Nevada, Reno, and colleagues compared the modern and historical ranges of the American pika within a 38-million-hectare area centered on Nevada 1. Surveys taken between 1994 and 1999 revealed that pikas were missing from six of the 25 study sites where they had been recorded from 1898 to 1956. But tallies taken at the same sites between 2003 and 2008 revealed another four extirpations, generating a nearly five-fold jump in local extinction rate. The most recent surveys revealed that the low-altitude edge of the pikas' range had moved upslope about 145 meters since the 1990s, about 11 times the rate of retreat seen during the twentieth century. Because pikas don't migrate and are generally faithful to their locale, the researchers speculate that rising temperatures have driven the heat-sensitive creatures from many sites they formerly inhabited. References Beever, E. A., Ray, C., Wilkening, J. L., Brussard, P. F. & Mote, P. W. Contemporary climate change alters the pace and drivers of extinction. Glob. Change Biol. doi:10.1111/j.1365-2486.2010.02389.x (2010).
Jan 19, 2011 Renewable Crude: from Times Online: Unbelievably, this is not science fiction. Mr Pal holds up a small beaker of bug excretion that could, theoretically, be poured into the tank of the giant Lexus SUV next to us. Not that Mr Pal is willing to risk it just yet. He gives it a month before the first vehicle is filled up on what he calls “renewable petroleum”. After that, he grins, “it’s a brave new world”.
The rest of the article: http://www.timesonline.co.uk/tol/news/environment/article4133668.ece
January 12, 2011 Fifteen of the Last Fifteen Years Have Been the Hottest Fifteen Years Ever Recorded 2010 tied 2005 as the hottest year ever recorded. 2005 was slightly warmer than the Super El Nino year of 1998 even though part of the year saw a moderate La Nina which has a significant cooling that lowers the global average temperature. A portion of 2010 saw a moderate El Nino, but a similar portion saw a moderate La Nina, so temperature change from the south and central Pacific where El Nino and La Nina are located, which are also the largest global temperature modifier, was about neutral this year.
2010 was the 34th year in a row where the global average temperature was warmer than the 20th century average. The globally average wettest year ever recorded was also 2010. Each year since 2000 has ranked as one of the 15 warmest years on record since 1880 when the records began. For the U.S. mainland, the 2010 average annual temperature was the 14th consecutive year above average and the 23rd warmest year on record.
Thompson, et. al., Kilimanjaro ice core records - evidence of Holocene change in tropical Africa, Science, October 2002.pdf
http://bprc.osu.edu/Icecore/589.pdf
January 11, 2011 We Already Know What to Do - But Action is Lacking: Make Your Comment To EPA About GHG Rules
Deadline January 31, 2011
Email to: oei.docket@epa.gov
Docket ID#: EPA-HQ-OGC-2010-1045
To the Environmental Protection Agency:
Ninety-seven to ninety-eight percent of climate scientists agree with the IPCC tenets on climate change. Those who disagree have published relative climate findings only about half as much as the rest. Of those who disagree, eighty percent have published fewer than 20 papers where only 10% of the IPCC group has published fewer than 20 papers. (Anderegg 2010)
Our atmospheric CO2 concentration is increasing 14,000 times faster than normal, for any time in the last 610 million years. (Zeebe 2008)
The upper limits for a safe atmospheric concentration of CO2 have been falling, since the discussion began, 20 or more years ago. Scientists from the University of California, Santa Barbara, now suggest that the safe upper limit is 300 ppm. (Morrigan 2010)
Irreversible tipping points threaten the very existence of life on Earth. Just because it appears to have been warmer on Earth today than it is now does not mean that irreversible tipping points will not be unintelligibly catastrophic for mankind. We don't know where these tipping points are, but we do know that they may be crossed as soon as this decade. We also know that prehistoric CO2 concentrations, for any time on Earth after green plants colonized land, were only about 1,000 ppm at the most, not 2,000 to 3,000 ppm as understood for decades. (Breeker 2009)
We know that sea level has jumped more than 10 feet in a century during the last interglacial warm period, 120,000 years ago, because of the collapse of the West Antarctic Ice Sheet, when the average temperature was within one degree of where it is today. (Blanchon 2009)
A mega-report by the U. S. Geological Survey, Environmental Protection Agency, National Oceanic And Atmospheric Administration and Department of Transportation, tells us that sea level rise of greater than 7 mm per year will cross a dynamic regeneration threshold for barrier islands and coastal wetlands resulting in their destruction. (USGS 2009)
In a murder trial, a suspect can be convicted and sentenced to death based on circumstantial evidence. Standards of science are even stricter than a murder trail as circumstantial evidence is generally not an accepted means of fact proving in the academic setting. Our society must dramatically reduce heat-trapping emissions deeply and quickly, including emissions from power plants and refineries. The Untied States has long been the lead nation on this planet and indeed is responsible for the lion’s share of carbon dioxide in our atmosphere today. It is our moral, ethical and equitable responsibility to lead the world in the stabilization of our atmosphere’s man-caused energy imbalance.
The EPA’s proposed timeline for implementation of greenhouse gas emission rules is supported by the urgency of the science. Please allow no delays, and make the substantive rules as stringent as possible.
Sincerely,
Bruce Melton P.E.
References:
Anderegg, et. al., Expert Credibility in climate change, PNAS April 2010.
Zeebe, Richard E., and Ken Caldeira. Close mass balance of long-term carbon fluxes from ice-core CO2 and ocean chemistry records. Nature Geoscience, Advance Online Publication, April 27, 2008.
Morrigan, Target Atmospheric Greenhouse Gas Concentrations: Why Humanity Should Aim for 350 ppm CO2e, University of Cal Santa Barbara.
Breecker, et. al., Atmospheric CO2 concentrations during ancient greenhouse climates were similar to those predicted for A.D. 2100, PNAS, October 2009.
Blanchon, et. al., Rapid sea level rise and reef back stepping at the close of the last interglacial highstand, Nature, April 2009.
US Geological Survey, Environmental Protection Agency, National Oceanic And Atmospheric Administration and Department of Transportation Report, U.S. Climate Change Science Program Coastal Sensitivity to Sea Level Rise: A Focus on the Mid-Atlantic Region, November 2009.
January 4, 2011 North Atlantic Current Change in Mid 20th Century - These biogeochemists are getting smarter everyday. Now they have determined how to identify different species of nitrogen that have been created in different areas. Tropical waters create one kind of nitrogen, polar waters create another. Deep water corals utilize nitrogen in growth. These researchers have sampled deep water corals in the northwest Atlantic off of Nova Scotia and found that their nitrogen source since the early 1970s has been that of the tropical variety. For the last 1600 years prior to the early 1970s though, the deep water corals off of Nova Scotia obtained their nutrients from polar waters. The authors of the paper conclude that it is likely that recent (the 1970s is recent in climate life) climate changes have impacted ocean circulation.
Sherwood et. al., Nutrient regime shift in the western North Atlantic indicated by compound-specific δ15N of deep-sea gorgonian corals, Proceedings of the National Academy of Science, November 2010.
January 3, 2011 Solar Cell Discovery New photovoltaic technology first reported almost a year ago is emerging that is nearly five times more efficient than current technology. It uses silicon, like normal crystalline cells, but a unique fabrication process uses only about 2% of the amount of silicon that normal cells use and the material is created in a flexible film. The cells are not only five times as efficient, they use very little of the expensive silicon.
http://media.caltech.edu/press_releases/13325
podcast: http://images.caltech.edu/podcasts/research_news/atwater_podcast.mp3
January 1, 2011 CO2 Emissions to Rise in 2011 Despite Recession A researcher at the University of Exeter in the UK leads a team that has published a paper in Nature Geoscience about projections for 2011 CO2 emissions. Based on emissions declines during the recession and projections of economic out put for 2011, the team has found that CO2 emissions will likely return to the level of emissions before the recession at about 3% per year. Their reasoning is that emissions fell only a relatively small amount in the developed world and in developing nations with economic out put it did not fall at all. the following is from a University of Exeter press release:
What we find is a drop in emissions from fossil fuels in 2009 of 1.3%, which is not dramatic,” lead researcher Pierre Friedlingstein from the UK’s University of Exeter told the state-funded BBC. “Based on GDP projections last year, we were expecting much more,” he added. “If you think about it, it’s like four days’ worth of emissions; it’s peanuts,” he said. Figures showed that emissions in Japan fell by 11.8%, in the UK by 8.6%, and in Germany by 7% — whereas the emissions continued to rise in developing countries with significant industrial output. China’s emissions, for instance, grew by 8%, and India’s by 6.2%. Professor Friedlingstein also said: "The 2009 drop in CO2 emissions is less than half that anticipated a year ago. This is because the drop in world Gross Domestic Product (GDP) was less than anticipated and the carbon intensity of world GDP, which is the amount of CO2 released per unit of GDP, improved by only 0.7 per cent in 2009 – well below its long-term average of 1.7% per year." The poor improvements in carbon intensity were caused by an increased share of fossil-fuel CO2 emissions produced by emerging economies with a relatively high carbon intensity, and an increasing reliance on coal. The study projects that if economic growth proceeds as expected, global fossil fuel emissions will increase by more than 3% in 2010, approaching the high emissions growth rates observed through 2000 to 2008.
Friedlingstein, et. al., Update on CO2 emissions. Nature Geoscience, 21 November 2010 DOI: 10.1038/ngeo1022
University of Exeter Press Release
December 28, 2010 Non CO2 Greenhouse Gas Warming Will Persist for Longer Than 1,000 Years Abstract: Emissions of a broad range of greenhouse gases of varying lifetimes contribute to global climate change. Carbon dioxide displays exceptional persistence that renders its warming nearly irreversible for more than 1,000 years. Here we show that the warming due to non-CO2 greenhouse gases, although not irreversible, persists notably longer than the anthropogenic changes in the greenhouse gas concentrations themselves.
Solomon et. al,. Persistence of climate changes due to a range of greenhouse gases. Proceedings of the National Academy of Sciences of the United States of America. 2010 Oct
Full text http://www.pnas.org/content/107/43/18354.long
December 20, 2010 Decreased Arctic Sea Ice and Increased Winter Extremes - Global Warming Really Does Make It colder! A decrease in Polar sea ice and the extreme winter events of the northeastern U.S. and Europe in 2005 have been recreated in modeling. It appears that warmer temperatures in the Arctic have an impact thousands of miles away as the jet stream makes a huge bend south. The results are snowpocali, or snowpocalypses. Only the winter of 2005 has been modeled so far, but the same conditions have been repeated nearly every year since, and the continued stormy winters in the Northeast and Europe attest to the trend.
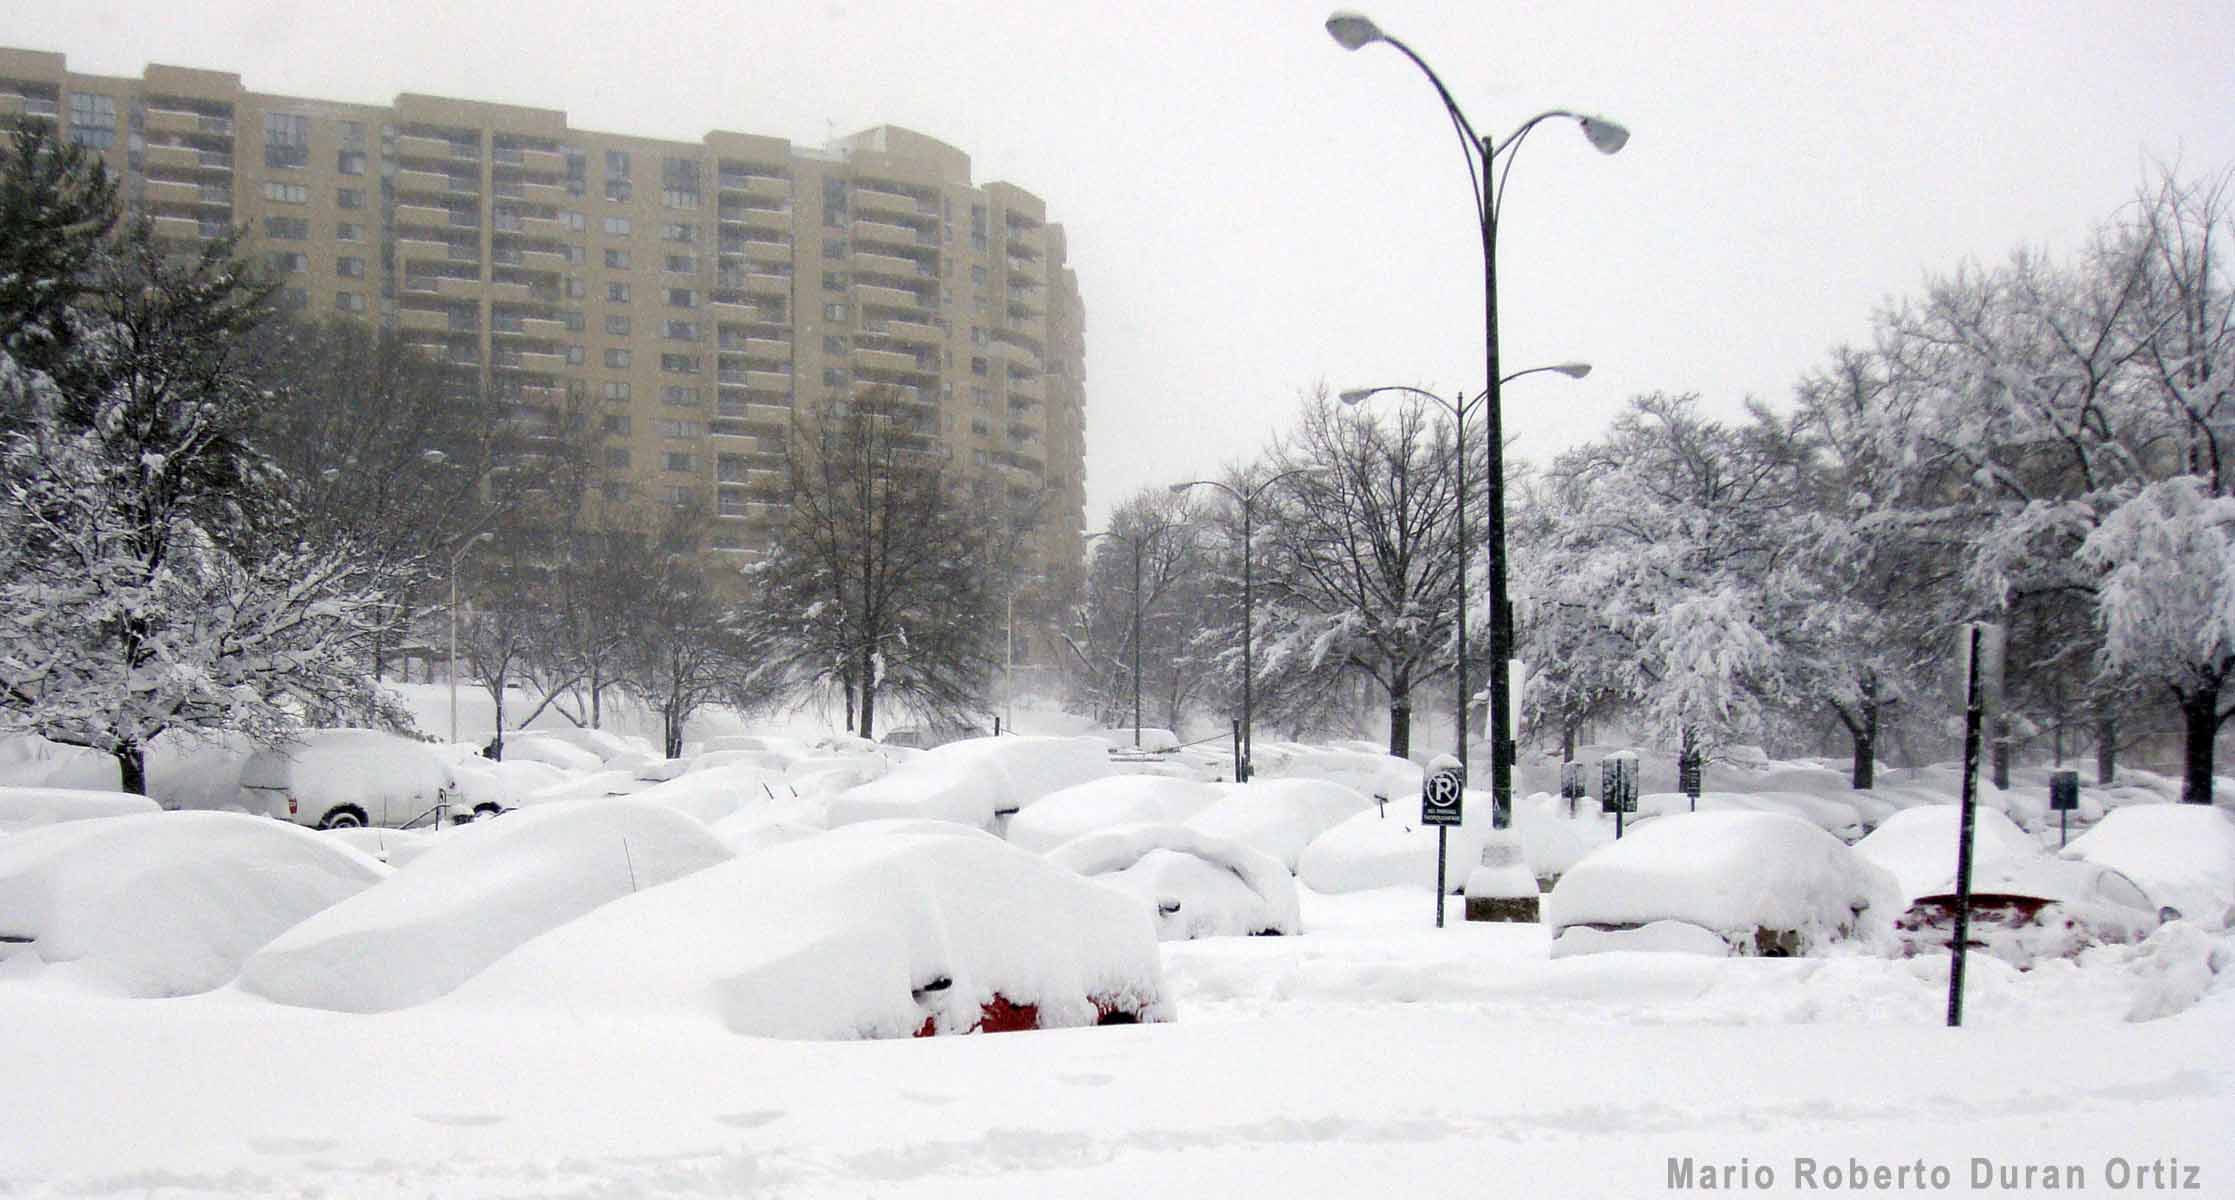
The models also show that this change in global weather patterns in these two areas tends to disappear as sea ice melt becomes more complete. It seems that the effect is strongest when sea ice is only partially melted. As warming needed to nearly or completely melt sea ice increases, the jet stream tends to lose its buckle and the extreme winter storminess does not eject as far south as it did when the jet stream was really bending south.
Paper Abstract: The recent overall Northern Hemisphere warming was accompanied by several severe northern continental winters, as for example, extremely cold winter 2005–2006 in Europe and northern Asia. Here we show that anomalous decrease of wintertime sea ice concentration in the Barents-Kara (B-K) seas could bring about extreme cold events like winter 2005–2006. Our simulations with the ECHAM5 general circulation model demonstrate that lower-troposphere heating over the B-K seas in the Eastern Arctic caused by the sea ice reduction may result in strong anticyclonic anomaly over the Polar Ocean and anomalous easterly advection over northern continents. This causes a continental-scale winter cooling reaching −1.5°C, with more than 3 times increased probability of cold winter extremes over large areas including Europe. Our results imply that several recent severe winters do not conflict the global warming picture but rather supplement it, being in qualitative agreement with the simulated large-scale atmospheric circulation realignment. Furthermore, our results suggest that high-latitude atmospheric circulation response to the B-K sea ice decrease is highly nonlinear and characterized by transition from anomalous cyclonic circulation to anticyclonic one and then back again to cyclonic type of circulation as the B-K sea ice concentration gradually reduces from 100% to ice free conditions. We present a conceptual model that may explain the nonlinear local atmospheric response in the B-K seas region by counter play between convection over the surface heat source and baroclinic effect due to modified temperature gradients in the vicinity of the heating area.
December 14, 2010 Twelve-month Average
Temperature
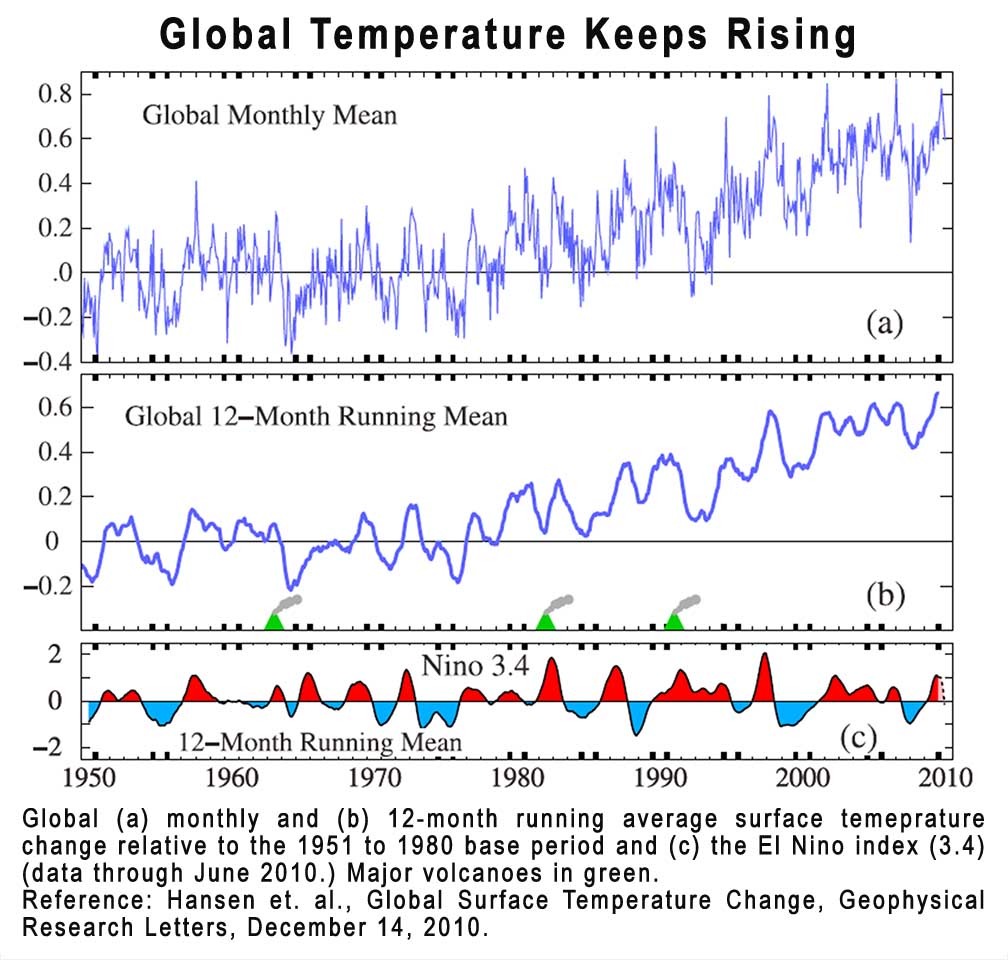 Reaches
All Time High The latest analysis of global temperature from
GISs looks at the 12-month running average global temperature. Using the
twelve month average smoothes out the chaos of monthly weather changes. The
running average averages successive twelve month periods: March through
February, April through March, May through April, etc. It's a little
different way of looking at the numbers that acts like a fine tuning knob.
It makes the "picture" more clear. It allows the "music" to be heard without
static. That static is the chaos of the weather.
Reaches
All Time High The latest analysis of global temperature from
GISs looks at the 12-month running average global temperature. Using the
twelve month average smoothes out the chaos of monthly weather changes. The
running average averages successive twelve month periods: March through
February, April through March, May through April, etc. It's a little
different way of looking at the numbers that acts like a fine tuning knob.
It makes the "picture" more clear. It allows the "music" to be heard without
static. That static is the chaos of the weather.
Look at the top line that shows average monthly temperature. That extreme jaggedness is the chaos. The running average smoothes out the chaos. Now look at the El Nino line. Red is the warm El Nino phase of the South Pacific, blue is the cool La Nina phase. See how the averaging is more easily seen in relationship to the El Nino / La Nina phases? El Nino and La Nina are the largest form of short-term global temperature fluctuations. Next are major volcanoes. Except for the 1984 eruption where we had the second largest El Nino warm phase, volcanoes serve to significantly cool the planet for a couple of years. What does it is all that smoke - those aerosols that come out of the volcano when it erupts. They block sunlight and keep the planet from warming.
Paper abstract: We update the Goddard Institute for Space Studies (GISS) analysis of global surface temperature change, compare alternative analyses, and address questions about perception and reality of global warming. Satellite-observed nightlights are used to identify measurement stations located in extreme darkness and adjust temperature trends of urban and peri-urban stations for non-climatic factors, verifying that urban effects on analyzed global change are small. Because the GISS analysis combines available sea surface temperature records with meteorological station measurements, we test alternative choices for the ocean data, showing that global temperature change is sensitive to estimated temperature change in polar regions where observations are limited. We suggest use of 12-month (and n×12) running mean temperature to fully remove the annual cycle and improve information content in temperature graphs. We conclude that global temperature continued to rise rapidly in the past decade, despite large year-to-year fluctuations associated with the El Niño-La Niña cycle of tropical ocean temperature. Record high global temperature during the period with instrumental data was reached in 2010.
Hansen et. al., Global Surface Temperature Change, Geophysical Research Letters, December 14, 2010.
December 13, 2010 Unprecedented Forest Die-off in Southwestern U.S. Two US Geological Survey researchers published a paper in the Proceedings of the National Academy of sciences of the United States of America this month and found, not only is there ongoing unprecedented forest die-off from warming and, drought, beetles and disease, but these forests are particularly susceptible to eco-regime change: these forests will likely change to grassland and scrub with continued warming. The USGS Press release says:
"...temperatures have increased particularly rapidly in
 the
Southwest relative to the rest of the continental U.S. This, combined with
the regional drought conditions common since 2000, means that trees in these
forests have already undergone significant and sustained stress, growth
declines, and increased mortality. Mountain forests across the Southwest are
already experiencing forest die-offs and rapid shifts in the relative
dominance of trees that live in them, Allen said. The authors estimate that
up to 18 percent of southwestern forests – that is, millions of acres – have
experienced high levels of bark-beetle and wildfire-related tree mortality
during recent warm droughts, an extent and rate unprecedented in the
documentary period of the past century. These trends – weaker trees, more
insect infestations, higher tree death rates, and more severe and frequent
fires – will get worse, the authors warn, if temperature and aridity in the
Southwest rise according to current climate projections. The authors
compared tree-ring growth records from more than 1,000 tree populations
across the United States with historical climate data to determine how tree
growth within each population is related to climate variability. They
concluded that southwestern forests are particularly sensitive to drought
and warmth. Of particular concern, they noted, is that drought-related
forest die-off events and severe forest fires can result in vegetation type
conversions from forest to shrub- and grass-dominated ecosystems in the dry
Southwest, presenting risks to both the socioeconomic and environmental
sustainability of the region. "Such big, fast changes in Southwest forest
vegetation could have significant effects on a wide range of ecosystem goods
and services, from watershed protection and timber supplies to biodiversity
and recreation," Allen said. "These emerging vulnerabilities present
increasingly clear challenges for managers of southwestern forests to
develop strategies to mitigate or adapt to the coming changes, in order to
sustain these forested ecosystems and their benefits into the future."
the
Southwest relative to the rest of the continental U.S. This, combined with
the regional drought conditions common since 2000, means that trees in these
forests have already undergone significant and sustained stress, growth
declines, and increased mortality. Mountain forests across the Southwest are
already experiencing forest die-offs and rapid shifts in the relative
dominance of trees that live in them, Allen said. The authors estimate that
up to 18 percent of southwestern forests – that is, millions of acres – have
experienced high levels of bark-beetle and wildfire-related tree mortality
during recent warm droughts, an extent and rate unprecedented in the
documentary period of the past century. These trends – weaker trees, more
insect infestations, higher tree death rates, and more severe and frequent
fires – will get worse, the authors warn, if temperature and aridity in the
Southwest rise according to current climate projections. The authors
compared tree-ring growth records from more than 1,000 tree populations
across the United States with historical climate data to determine how tree
growth within each population is related to climate variability. They
concluded that southwestern forests are particularly sensitive to drought
and warmth. Of particular concern, they noted, is that drought-related
forest die-off events and severe forest fires can result in vegetation type
conversions from forest to shrub- and grass-dominated ecosystems in the dry
Southwest, presenting risks to both the socioeconomic and environmental
sustainability of the region. "Such big, fast changes in Southwest forest
vegetation could have significant effects on a wide range of ecosystem goods
and services, from watershed protection and timber supplies to biodiversity
and recreation," Allen said. "These emerging vulnerabilities present
increasingly clear challenges for managers of southwestern forests to
develop strategies to mitigate or adapt to the coming changes, in order to
sustain these forested ecosystems and their benefits into the future."
Press Release http://www.usgs.gov/newsroom/article.asp?ID=2663
Williams, A.P., C.D. Allen, T.W. Swetnam, C.I. Millar, J. Michaelsen, C.J. Still, and S.W. Leavitt. 2010. Forest responses to increasing aridity and warmth in southwestern North America. Proceedings of the National Academy of Sciences, U.S.A. Vol. 107, No. 50. doi: 10.1073/pnas.0914211107
December 6, 2010, Coral Bleaching Could be the Worst Ever in 2010 The Australian Research Council (ARC) said in press release that reefs are dead or dying across the Indian Ocean and into the Coral Triangle because of extra warm surface waters from the Seychelles in the west to Sulawesi and the Philippines in the east including reefs in Sri Lanka, Burma, Thailand, Malaysia, Singapore, and many sites in western and eastern Indonesia."
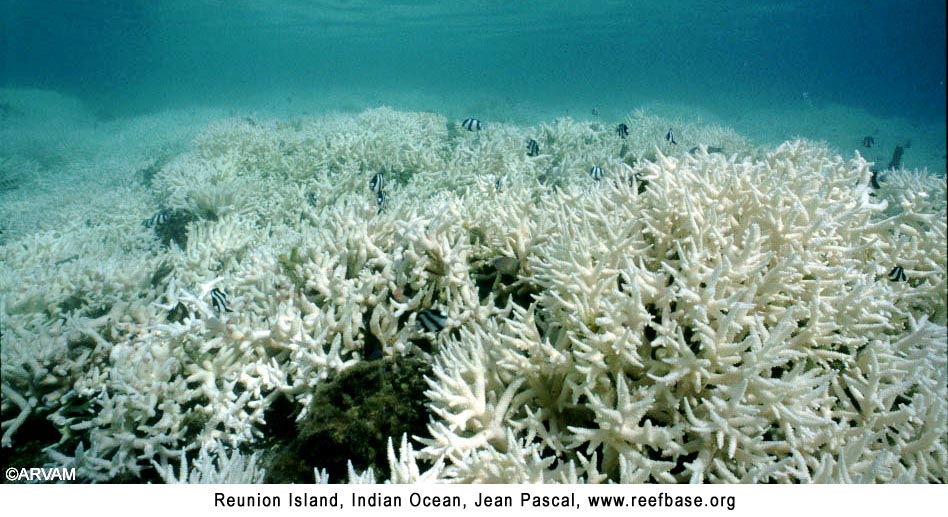
“It is certainly the worst coral die-off we have seen since 1998. It may prove to be the worst such event known to science ... Coral cover in the region could ... drop from an average of 50% to around 10%, and it will take years to recover" says Dr Andrew Baird of the ARC.
The ARC Press Release continues: Marine ecologists from the Wildlife Conservation Society, CoECRS and Syiah Kuala University rate this event as one of the worst coral diebacks ever recorded. `My colleagues and I have high confidence these successive ocean warming episodes, which exceed the normal tolerance range of warm-water corals, are driven by human-induced global warming.
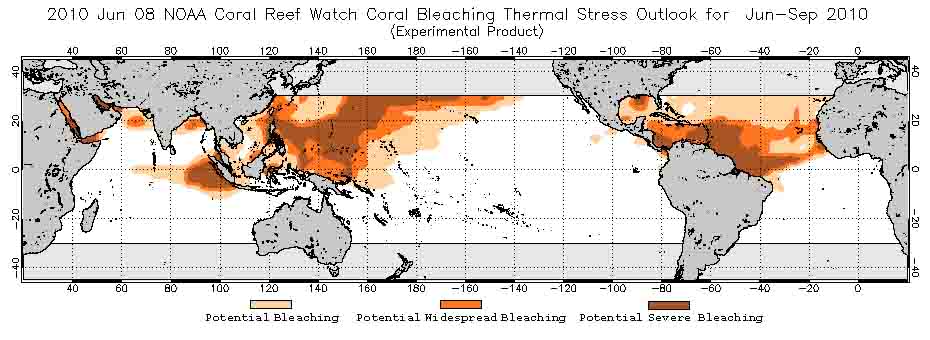
They underline that the planet is already taking heavy hits from climate change – and will continue to do so unless we can reduce carbon emissions very quickly. `They also show this is not just about warmer temperatures: it is also threatening the livelihoods of tens of millions of people and potentially the stability of our region.'
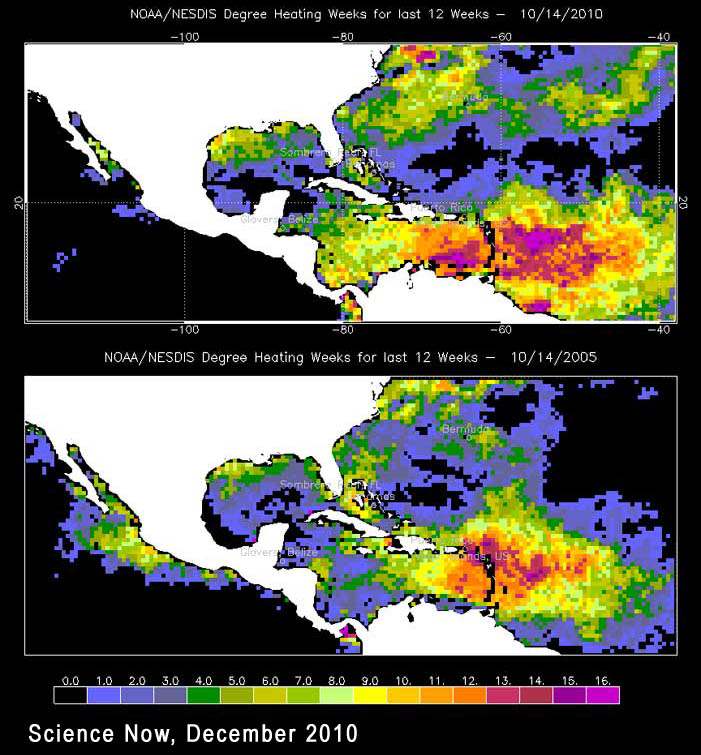 NOAA says that the 12-month period ending June 2010 was the warmest 12-month
period in the thermometer record. Last winter was the second warmest winter
ever recorded globally and 2010 will probably tie 2005 as the hottest year
ever (link).
The World Meteorological Organization says that 2010 will be in the top
three warmest, possibly the warmest, and that the ten-year period 2001 to
2010 is the hottest ten-year period of the instrument record. (link).
The National Martine Fisheries Service is currently considering the listing
of 82 species of coral in U.S. waters as endangered because of continued
die-off and the threat of extinction from warming.
NOAA says that the 12-month period ending June 2010 was the warmest 12-month
period in the thermometer record. Last winter was the second warmest winter
ever recorded globally and 2010 will probably tie 2005 as the hottest year
ever (link).
The World Meteorological Organization says that 2010 will be in the top
three warmest, possibly the warmest, and that the ten-year period 2001 to
2010 is the hottest ten-year period of the instrument record. (link).
The National Martine Fisheries Service is currently considering the listing
of 82 species of coral in U.S. waters as endangered because of continued
die-off and the threat of extinction from warming.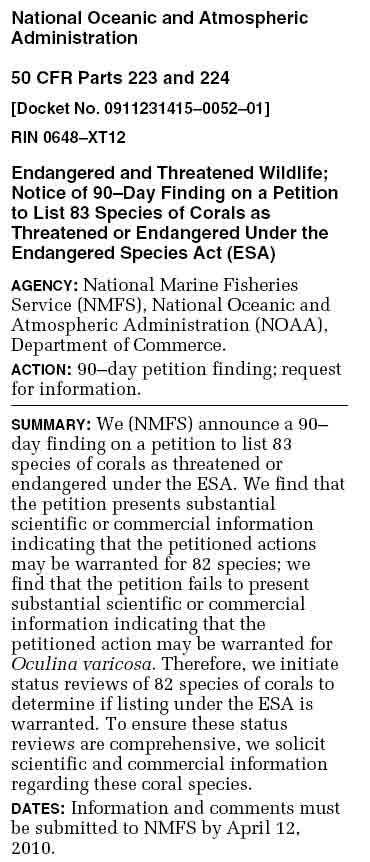
The extreme heating in the Caribbean Sea shows up well in the NASA image of heating degree weeks. The warmer colors combine temperature and time to evaluate the amount of long-term stress on coral reefs. The comparison is made to 2005 because this year in the Caribbean was even warmer than the Super el Nino year of 1998.
"Profound ecological changes are occurring on coral reefs throughout the tropics" says a team of 32 scientists who have released a report that summarized 48 research project covering 318 reefs and 273 reef fish species during the period 1955-2007 across the Caribbean Sea. The scientists say the half of the fish species groups studied are decreasing at 2.6 to 6% loss per year. This loss rate is equal to 22 to 43 percent over 10 years. The decline started about 1995.Because the species groups span game and commercial fish species as well as non commercial and non game fish species, over fishing is not the problem.
%20annotated%20copy.jpg) What is happening is a result of coral reef decline due
to climate change, put more succinctly, "...drastic recent degradation of
reef habitats... indicate that Caribbean fishes have begun to respond
negatively to habitat degradation." Corals cover has been reduced
"drastically" across the Caribbean region since the mid-1970s. The reduction
is estimated to be 80% (Gardener 2003).
What is happening is a result of coral reef decline due
to climate change, put more succinctly, "...drastic recent degradation of
reef habitats... indicate that Caribbean fishes have begun to respond
negatively to habitat degradation." Corals cover has been reduced
"drastically" across the Caribbean region since the mid-1970s. The reduction
is estimated to be 80% (Gardener 2003).
The reason that the team believe that the fish decline did not coincide with the reef decline is that coral skeletons persist for decades. It is the structure of the reef that provides much of the benefits of the reef habitat. After several decades, this structure starts to disintegrate an so goes the fish population.
The February 10 Federal Register published a petition for this extensive listing citing the number one reason as warming oceans due to climate change. The petition states that all of the petitioned species have suffered losses of 30% or more over a 30-year period placing them at high risk of extinction according to the IUCN guidelines (International Union for the Conservation of Nature). The petition continues "...the region suffered massive losses of corals in response to climate-related events of 2005, including a record-breaking series of 26 tropical storms and elevated ocean water temperatures". The petition goes on "...the U.S. Virgin Islands lost 51.5 percent of live coral cover, and that Florida, Puerto Rico, the Cayman Islands, St. Maarten, Saba, St. Eustatius, Guadeloupe, Martinique, St. Barthelemy, Barbados, Jamaica, and Cuba suffered bleaching of over 50 percent of coral colonies, citing Carpenter et al. (2008). The petitioner cites Gardner et al. (2003) in asserting that, over the three decades prior to the 2005 events, Caribbean reefs had already suffered an 80 percent decline in hard coral cover, from an average of 50 percent to an average of 10 percent throughout the region."
The most alarming statement in the petition follows: "... these corals face significant threats. To support this assertion, the petitioner cites Alvarez-Filip et al. (2009) in noting the dramatic decline of the three dimensional complexity of Caribbean reefs over the past 40 years, resulting in a phase shift from a coral-dominated ecosystem to fleshy macroalgal overgrowth in reef systems across the Caribbean." This "fleshy macroalgal overgrowth" - what this means is that most of the corals have died and have been replaced by a green or brown slime of algae.
Gaskill, News Item, Coral bleaching goes from bad to worse, Nature, November
2010
http://www.nature.com/news/2010/101119/full/news.2010.621.htmla>
Eakin, et. al.,
Caribbean Coral reefs in Crisis - Record Thermal Stress, Bleaching and
Mortality in 2005, PLOS, November 2010.
http://www.plosone.org/article/info:doi/10.1371/journal.pone.0013969
Science Now, Kintisch October 14, 2010, Caribbean Coral Die-Off Could
Be Worst Ever
http://news.sciencemag.org/sciencenow/2010/10/caribbean-coral-die-off-could-be.html
http://www.noaanews.noaa.gov/stories2010/20101115_coralbleaching.html
Endangered Species Petition for 82 coral species:
http://www.nmfs.noaa.gov/pr/pdfs/species/coral_petition_cbd.pdfa>
http://www.coralcoe.org.au/news_stories/regionalbleaching.html
ARARC
Press Release October 19, 2010
November 26, 2010 Superhero Ice Scientists
Lonnie Thompson's Article in the Behavior Analyst The ice fields atop Mount Kilimanjaro have lost 85 percent of their
The Quelccaya ice cap in southern Peru -- the largest
tropical ice field on Earth, has retreated 25 percent since 1978; Ice fields in the Himalayas that have long shown traces
of the radioactive bomb tests in the 1950s and 1960s have since lost that
signal as surface melting has removed the upper layers and thereby reduced
the thickness of these glaciers; All of the glaciers in Alaska's vast Brooks Range are
retreating, as are 98 percent of those in southeastern Alaska. And 99
percent of glaciers in the Alps, 100 percent of those in Peru and 92 percent
in the Andes of Chile are likewise retreating; The ice fields that top Mount Kilimanjaro, Africa's
highest peak, could disappear within 25 years because of rising global
temperatures, scientists say. Read more:
http://www.cbc.ca/technology/story/2009/11/02/tech-climate-kilimanjaro-glacier.html#ixzz1AhZwqQON
In 2000, Thompson and his colleagues found a layer of ice
1.6 metres below the surface of Kilimanjaro's Northern Ice Field with a
radioactive marker corresponding to the Operation Ivy nuclear weapons tests
in the Marshall Islands in 1952. The marker has been found in glaciers
around the world. That layer is now gone at Kilimanjaro, the ice field
having lost 2.5 metres of thickness between 2000 and 2007. 'Lost half of its
thickness' The tops of both the Northern and Southern Ice Fields have
thinned, by 1.8 metres and 5.1 metres, respectively. A smaller glacier,
called Furtwangler, has thinning about 50 per cent between 2000 and 2009.
Read more:
http://www.cbc.ca/technology/story/2009/11/02/tech-climate-kilimanjaro-glacier.html#ixzz1Aha74H5C
They found elongated air bubbles trapped in the ice at
the top of one of the glacier cores, suggesting the surface ice melted and
refroze. They found no other evidence of such melting in the column of ice
drilled out of the glacier. A 300-year drought about 4,200 years ago left a
two-centimetre layer of dust in the core, but no evidence of sustained
melting. Read more:
http://www.cbc.ca/technology/story/2009/11/02/tech-climate-kilimanjaro-glacier.html#ixzz1AhaKlXme
Between measurements in 1976 and 2000, the area of
Furtwängler Glacier was cut almost in half, from 113,000 m² to 60,000 m².
During fieldwork conducted early in 2006, scientists discovered a large hole
near the center of the glacier. This hole, extending through the 6 meter
(20 ft) remaining thickness of the glacier to the underlying rock, is
expected to grow and split the glacier in two by 2007. The 2006 study found
that no new glacial ice has accumulated on any of the glaciers on the
mountain in the 21st century. Behavior Analysts Climate Special Fall 2010
http://www.abainternational.org/journals/HumanResponseToClimateChangeIdeasFromBA.pdf Thompson, et. al., Kilimanjaro ice core records -
evidence of holocene change in tropical africa, Science, October 2002
http://www.geo.umass.edu/climate/doug/pubs/thompson_etal_sci02.pdf
November 11, 2010
Misleading Reporting from Smithsonian About
Tropical Forests on a Warmer Planet An article in Science,
published by the good folks at the Smithsonian, reports that 56 million
years ago when Earth was 3 to 5 degrees C warmer durign a freak super abrupt
climate change called the Eocene / Paleocene Thermal Maximum; in 10,000
years, CO2 doubled. The reuslting warming lasted for 200,000 years. The best
cause for the warming at this time was probably gassing of methane
clathrates, but there is still a lot of questions as to why the event
occured. This resaerch team found that, on a warmer planet, tropical forests
were more diverse. they looked at preserved pollen in 56 million year cracks
in rocks. The authro of thepress release repeateeddly illuded to this
finding as something that may not neccesarily mean that warming to come in
the future will mean bad things for tropical forests. The study sites
were in far northeastern Columbia and far northwestern Venezuela. Once, near
the bottom of the release, one of the authors was quoted. He mentioned the
possibility that some computer models said that drying could lead to
droughts that would mean that their findings did not make sense.
What makes less sense however is that it is a well established projection
that the interior of continents will become drier as our climate changes.
These sceintists study sites that were near what was then the
Caribea-Pacific Ocean / Sea. You see, The Isthmus of Panama had not
risen from the ocean yet. What's more, the Northern Andes had not been
uplifted yet either. The Earth that this press release compares to tody was
hardly similar to Earth today.
Simple findings such as this should not be compared to anything, unless the
author has a full understanding ... or at least a half-assed understanding
of what the hell is going on!
Jaramillo, et. al., Effects of Rapid Global Warming at the Paleocene-Eocene
Boundary on Neotropical Vegetation, Science, November 2010.
http://striweb.si.edu/publications/PDFs/STRI-W_Jaramillo_2010_et-al_Paleocene_Eocene_boundary.pdf
October 28, 2010 Global
Warming has Already
Doubled the Droughts and Floods in the U.S. Southeast
A
Duke University-led team of climate scientists
has
looked at 60 years of U.S. and European weather and climate data and found
the Bermuda High has increased in intensity. Their finding have shown that
this, in-turn, has led to an increase in the intensity of the weather
extremes in the southeastern U.S.
The Bermuda High, called the Azores High in Europe, is a semi-permanent
high pressure area in the south central North Atlantic Ocean that has
ocean-wide, semi-hemispherical impacts on the weather. It plays different
roles in driving weather systems from Africa to North America and from North
America to Europe and Scandinavia.
“This is not a natural variation like El Nino,” says lead author Wenhong Li,
at Duke's University’s Nicholas School of the Environment. “We thoroughly
investigated possible natural causes ... Our analysis strongly suggests that
the changes in the [Bermuda High] are mainly due
to anthropogenic warming.
The team found that, not only did the Bermuda High get stronger, but it
moved westward. At the same time, extreme weather in the U.S.
Southeast (rain storms and drought) have doubled in the last 30 years.
So far the increases in extremeness has been split almost 50/50 between wet
and dry extremes. What will the future be, as seen by the team? It
depends on the future track of the high. If it is a little more northwest,
the future will be
dryer, a little more southwest, wetter.
"It took more than three thousand years to make some of the trees in these
western woods ... Through all the wonderful, eventful centuries since
Christ's time—and long before that—God has cared for these trees, saved them
from drought, disease, avalanches, and a thousand straining, leveling
tempests and floods; but he cannot save them from fools." John Muir
Duke Press Release:
http://www.nicholas.duke.edu/news/increasingly-variable-summer-rainfall-in-southeast-linked-to-climate-change
Li, et. al., Changes to the North Atlantic Subtropical High and Its Role in
the Intensification of Summer Rainfall Variability in the Southeastern
United States, Journal of Climate, October 2010.
October 15, 2011 Russia On Fire: a Sign of Things to Come
"In Russia, the wildfires are believed caused by a warming climate that made
the current summer the hottest on record. The hotter weather increases the
incidence of lightning, the major cause of naturally occurring biomass
burning. Soja said she hopes the wildfires in Russia prompt the country to
support efforts to mitigate climate change. In fact, Russia's president,
Dmitri A. Medvedev, last month acknowledged the need to do something about
it. "What's happening with the planet's climate right now needs to be a
wake-up call to all of us, meaning all heads of state, all heads of social
organizations, in order to take a more energetic approach to countering the
global changes to the climate," said Medvedev, in contrast to Russia's
long-standing position that human-induced climate change is not occurring."
http://climate.nasa.gov/news/index.cfm?FuseAction=ShowNews&NewsID=400
October 12, 2010 More Frequent and Extreme Storms Causing More
Runoff In All of the Wrong Places Freshwater is flowing into
Earth's ocean in greater amounts every year, thanks to more frequent and
extreme storms related to global warming, according to a first-of-its-kind
study by a team of NASA and university researchers.
"In general, more water is good," Famiglietti said. "But here's the problem:
Not everybody is getting more rainfall, and those who are may not need it.
What we're seeing is exactly what the Intergovernmental Panel on Climate
Change predicted - that precipitation is increasing in the tropics and the
Arctic Circle with heavier, more punishing storms. Meanwhile, hundreds of
millions of people live in semiarid regions, and those are drying up."
http://www.jpl.nasa.gov/news/news.cfm?release=2010-322
October 9, 2010 CO2 Changing 14,000 Times
Faster than Normal This article in the journal Nature
Geoscience looked at CO2 changes from the last 610,000 years as told in the
bubbles of trapped air in Antarctic ice cores. It is a well known part of
climate science that states that CO2 concentrations in our atmosphere differ
based on the climate. CO2 levels are lower on a cooler planet and
higher on a warmer planet.
CO2 levels tend to slightly follow temperature in a feedback reaction, that
is, a little warming, say from an increase in energy from the sun due to
changes in Earth's rotation around the sun, causes an increase in CO2
levels. More CO2 makes it warmer, which causes an even greater increase in
CO2, etc.
This study, led by Dr. Richard Zeebe at the University of Hawaii,
found that over hundreds of thousands of years the equilibrium between
carbon dioxide input and removal by natural sequestration was never more
than one to two percent out of balance, showing that, over time, the earth balances it own chemistry.
The difference in ancient carbon dioxide concentrations between the depths of
the ice age and the warmth of the interglacial periods, was about 22 parts
per million (ppm). This oscillation, this swing between the two extremes
happened about every 100,000 years.
But in the last 200 years, we have changed the CO2 concentration on this planet
by 100 ppm. In just these last 200 years, we have burned a fair amount
of all of the fossil carbon stored as oil, gas and coal, for the last 350
million years.
Professor Zeebe says
"Before anthropogenic emissions were added to the equation, the system was
nicely balanced ... But this has changed. The average man-made increase in
atmospheric CO2 from fossil fuel burning and deforestation over the past 200
years is about 14,000 times faster than the long-term average change over
the past 610,000 years."
Press Release University of Hawaii:
http://www.hawaii.edu/news/article.php?aId=2272
Zeebe, Richard E., and Ken Caldeira. Close mass balance of long-term carbon
fluxes from ice-core CO2 and ocean chemistry records. Nature Geoscience,
Advance Online Publication, April 27, 2008.
October 6, 2010 Phenomanl Ice Videos - NASAs Global Ice
Viewer From the Ilulissat Glacier in Western Greenland tohte
Wilkins Ice Sheet in Antarctica. these videos and still photo comparisons
show climate hcange iun action.
http://climate.nasa.gov/GlobalIceViewer/index.cfm
October 4, 2010 Summer Was Fourth Warmest in 131 Years
"An unparalleled heat wave in eastern Europe, coupled with intense droughts
and fires around Moscow, put Earth’s temperatures in the headlines this
summer. Likewise, a string of exceptionally warm days in July in the eastern
United States strained power grids, forced nursing home evacuations, and
slowed transit systems. Both high-profile events reinvigorated questions
about humanity’s role in climate change."
http://climate.nasa.gov/news/index.cfm?FuseAction=ShowNews&NewsID=409
October 1, 2010 Phenomenal Ice Show - NASAs Ice Viewer
From Greenland to Antarctica, these videos and still photo comparisons show
climate change in action.
http://climate.nasa.gov/GlobalIceViewer/index.cfm
October 8, 2010 Fred Singer:
Amazing Singer is an 83 year old physicist who made a
name for himself back in the old days studying clouds. Singer also made a
name for himself fighting against the anti-smoking movement, fighting
against environmental regulations to curb acid rain, and fighting against
environmental regulations to protect the ozone layer. Now of course he is a
non-climate science crusader.
With scientists like this one, who needs climate Armageddon? (Between 97 and
98 percent of 1300 climate scientists polled support man-caused climate
change science see here.)
September 29, 2010 The North American Pine Beetle Pandemic I
just returned from a 7,500 mile trip to witness the the greeatest insect
infestation enaywhere in recorded history. This is an ongoing project of
mine, and will be my thrid film drawing public attention to this extreme
climate change impact.
My Scientific Basis for this years film is here:
http://www.meltonengineering.com/North%20America%27s%20Mountain%20Pine%20Beetle%20Pandemic%20February%202011color.pdf
September 23, 2010
The Carbon Footprint of a New Car
(United Kingdom)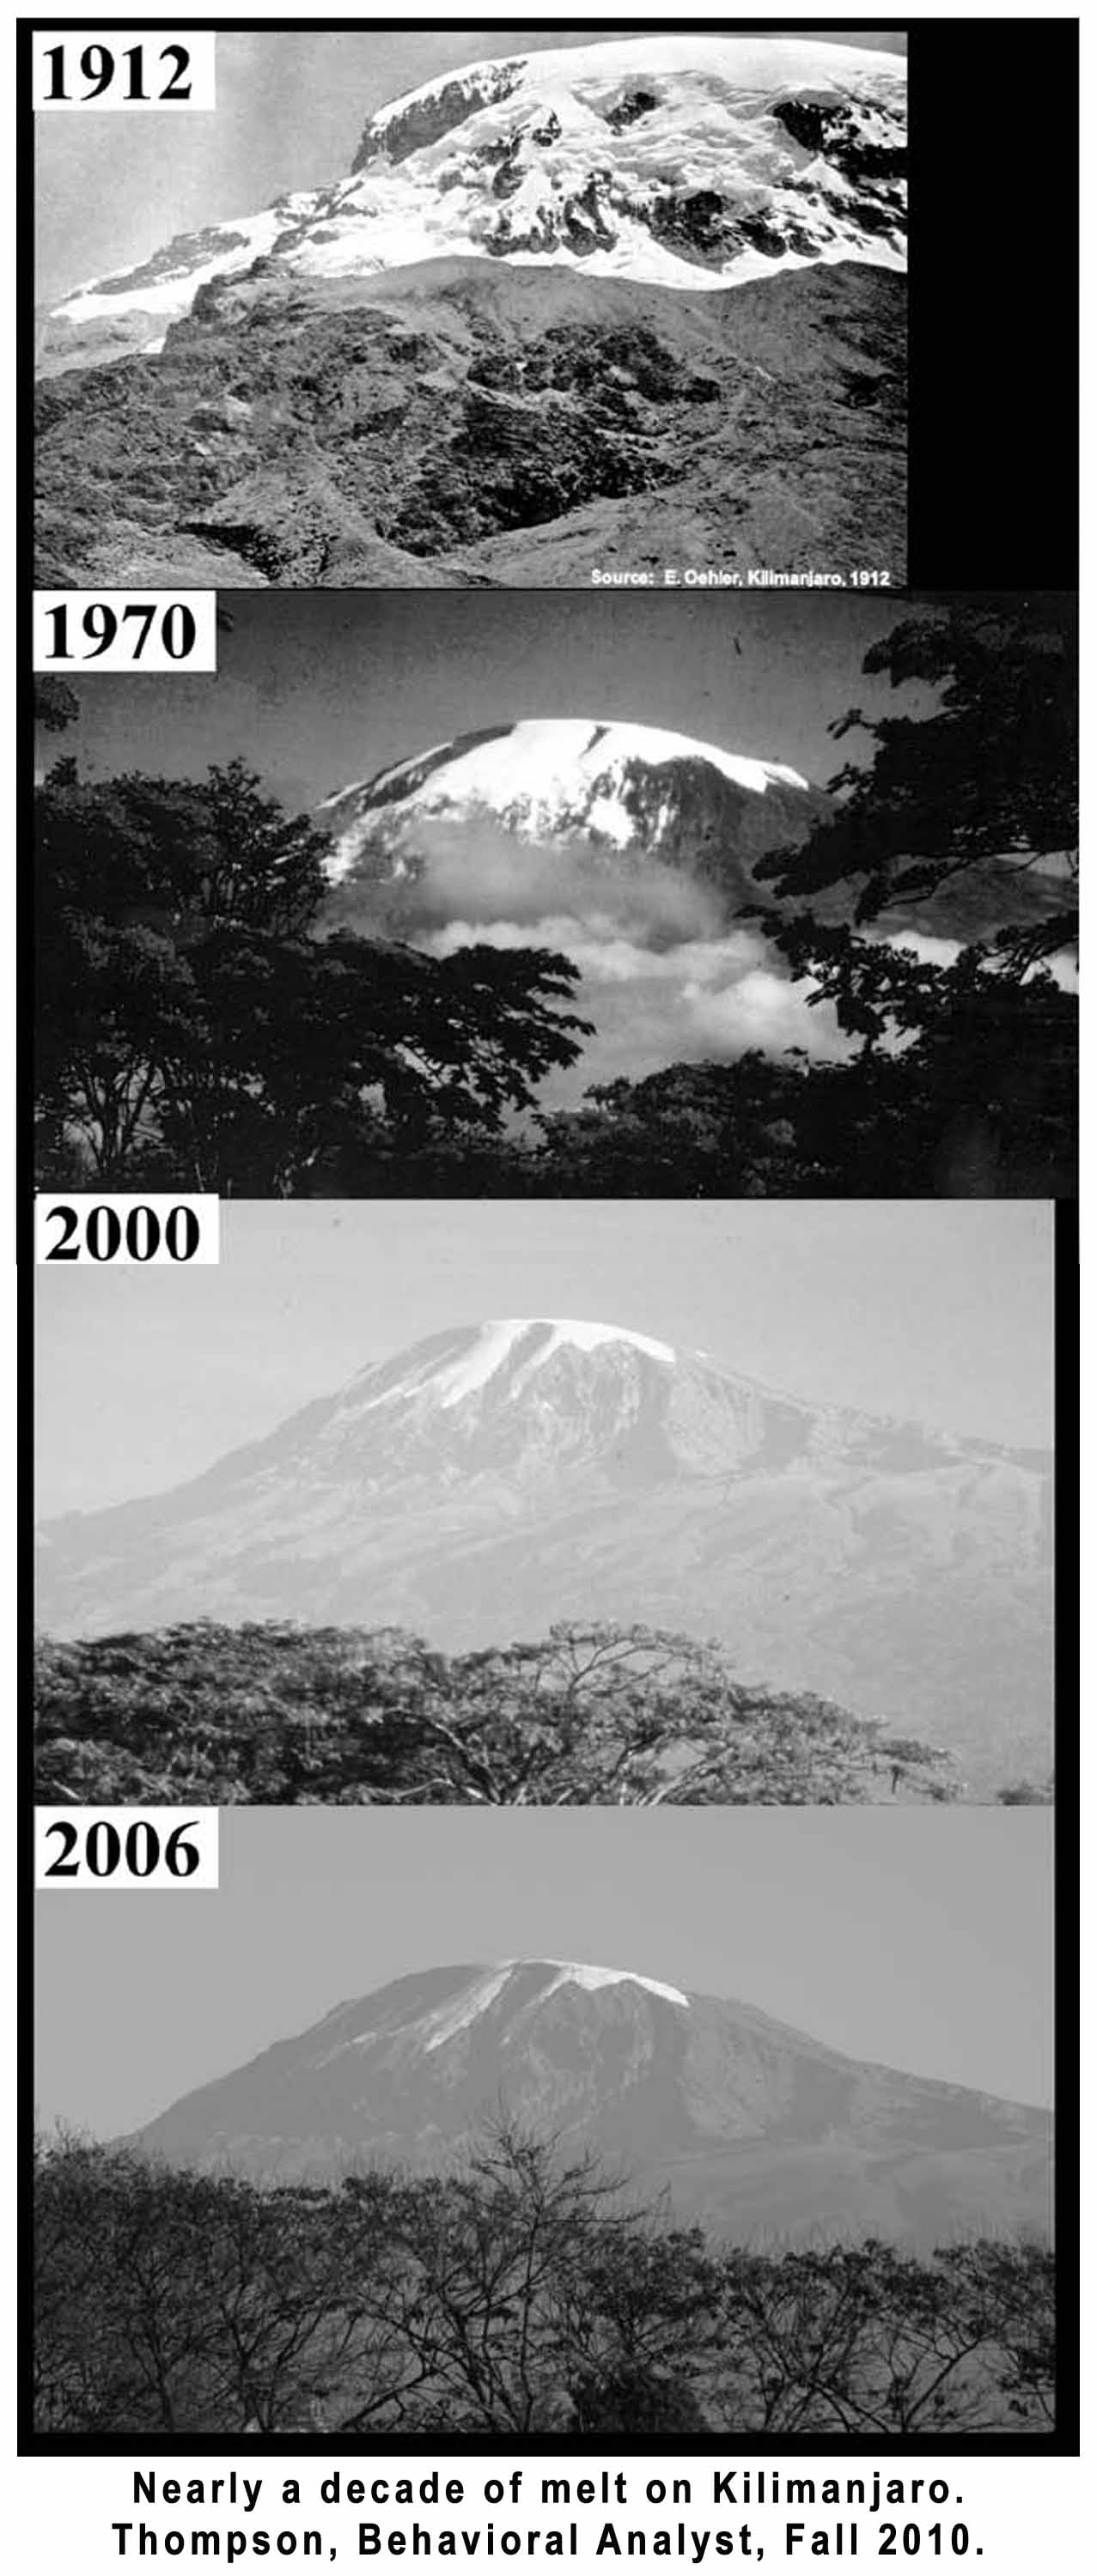 coverage
since 1912;
coverage
since 1912;
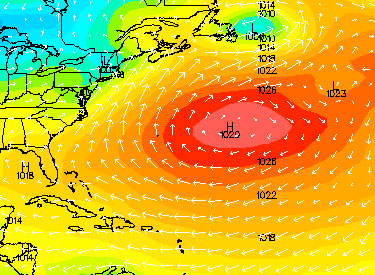
6 tons
CO2ea: Citroen C1, basic specification
17 tons
CO2ea: Ford Mondeo, medium specifications
35 tons
CO2ea: Land Rover Discovery, top of the range
http://www.guardian.co.uk/environment/blog/2010/jun/04/carbon-footprint-definition
September 20, 2010
The Psychology of Global Warming, American
Meteorological Society
The certainty that climate scientists have about climate changes becomes
greater every day. Yet, the portion of the public that agrees with the
principles of man-caused climate change, or the risks faced, or the
speed with which our climate is changing, or even the understanding of the
certainty of the scientists themselves, is far below that of the scientists,
and it is falling.
The first thing Newell and Pitman say is that the public reality confuses
climate with weather. That they get their contexts mixed up and don't really
understand that weather means so little to the big picture. The public
doesn't realize that even though our daily weather changes 20 or thirty or
more degrees, that just a few degrees of change to our average temperature
can mean curtains for many ecosystems across the Earth.
The general public doesn't understand that a few degrees of change in Polar
regions, or high elevation mountains, where snow covers the ground much of
the year, will lead to two to three times more temperature change because of
the "albedo effect". The albedo effect is increases warming as the snow
melts, because snow reflects almost all of the suns energy back into space.
Ground, or vegetation , rocks or water absorbs nine times more heat than
snow and ice reflect. This heat stays on earth, it is trapped by the
greenhouse effect as heat - it is not reflected harmlessly back into space
as light. this extra warming then goes on to melt even more snow,
which results in even more warming, etc.
These things that the public does not know have a compounding effect.
Warming in Arctic regions for example implies changes to weather systems
that impact large portions of the Northern Hemisphere.
Warming in the
high Rockies decreases the water supply to the western half of the U.S. This
drought amplification process is extremely worrisome.
By the end of the century, North America will experience four to seven
droughts per century that are as big as the biggest drought that occurred in
the 20th Century. What this means is that we will be bombarded by Dust Bowl
extreme drought every ten to twenty years. This will be like having a
100-year flood every 10 to 20 years, only in reverse. Even more worrisome. The 1,000 year drought will now be an occurrence
that happens every 100 years or even less.
Newell and Pitman, The Psychology of global warming, American
Meteorological Society, August 2010.
http://journals.ametsoc.org/doi/pdf/10.1175/2010BAMS2957.1
September 10, 2010 Arctic Sea - Functionally
Ice Free Now A few out there would have us believe
that Arctic
sea ice has rebounded since 2007 and that climate change is something other
than what it is. In the real world, what little is left of Arctic sea
ice is so rotten and weak that it is no functional impediment to shipping -
leaving the Arctic Ocean functionally in an "ice free" state. More on
that latter. But now, the continued and unprecedented decline in
Arctic sea ice needs to be understood. The "non-scientists" say that this year's
2nd lowest extents estimate is not lower than the record 2007 area and this,
along with the 2008 and 2009 estimates of Arctic sea ice coverage prove that
sea ice in the Arctic is indeed rebounding.
This revelation
is a ruse. Chaos rules in Arctic sea ice as in the weather
everywhere. In-fact, Arctic sea ice extents are controlled significantly by
polar winds. The 2007 record was helped along by relatively out of the
ordinary winds that pushed the ice together - bunched it up, increasing the
amount of open water.
You see, large numbers of floating objects, in the absence of winds, tend to
spread themselves out evenly over any water surface. Ice behaves no
differently. Arctic sea ice in mid summer is frail and broken into
millions and millions of pieces. Winds push it around. So sea ice extent may
not be the best measure of the quantity of sea ice in the Arctic. It
is a tool however, and it should not be misused.
Another tool is ice volume, calculated from area extents and thickness.
From this tool, we know that sea ice in the Arctic has
genuinely not
"recovered" from the 2007 record. We have two tools to determine
volume: The U.S. military submarine ice thickness records and the ICESat
satellite thickness data beginning in 2005.
So even though ice extents tells a picture of sea ice coverage, ice volume
tells even more. Ice volume is a product of ice and warmth. More warmth
equals less total ice. As our planet warms, less ice is the consequence.
This phenomena is another of the climate feedback mechanisms. Ice and snow reflect about
90% of sunlight harmlessly back into space. Open water absorbs about 90% of
sunlight and changes into infrared energy - heat. This heat is then
trapped by greenhouse gases and stays on the planet. So, less ice increases
the melt of the remaining ice in two ways: one is by warming the atmosphere
through the greenhouse effect; the other is by warming sea water by the
absorption of energy from the sun.
Feedback effects all work the same way. Energy builds up in a system
over time. It keeps building up without much happening. Then at some point
at threshold is passed, a tipping point is reached and suddenly the system
changes state. Think of leaning out across the gunwales of canoe. As you
lean further, the canoe continues to lean with you until all at once, the
canoe reaches that tipping point and suddenly flips over into the water.
Ecosystems process are generally no different. This tipping point can be
seen in the Arctic Sea Ice Volume Trend chart by Maslowski.
Since volume, determined from area extents and ice thickness, is the
better measure of the state of Arctic sea ice, then we need to pay more
attention to sea ice volume than sea ice extents. Extents can be influenced
by the chaos of weather and the winds, as is evident in the 2007 extents
record, but volume continues to decrease with no sign of the anomaly that
was presented in 2007 by the winds of chaos. Ice volume has continued to
drop, with no recovery evident. The decrease in volume is so large
that the U.S. Naval Post Graduate school says that we will functionally see
an ice free Arctic Ocean between 2012 and 2016.
Maslowski's graph, by the way, was first published in 2003. It has not
changed since, only more data points have been added. The new data
points seem to be following the original trend.
How large is the decline? It is about 10,000 cubic kilometers lower than the
1979 to 2009 average. Considering that the average is about 21,000
cubic kilometers, this decrease is incredibly huge. What does this
mean? It means that our planet is approaching an environmental state
that has not been seen in 14 million years
(see here).
In 2007 it was clear that Arctic sea ice melt was progressing 70 years ahead
of the model's predictions. See
here and
here. It was also clear that a tipping point had been reached and the
rate of sea ice loss had accelerated. This knowledge has not only
remained the same, but become more robust as new evaluation techniques and
more man hours are put into research.
This is yet another sign that we have crossed a global climate threshold and
are progressing through an abrupt climate change. This time, the
change is big. Bigger than anything in the
last 14 million years.
White et. al., (2010) says in the July issue of Quaternary Science Reviews,
that man caused climate change today is as large as anything that we have a
record of occurring, that is, today's climate change is as large as the
largest abrupt climate change that has ever happened.
But this is just what he and his team says about climate change today.
What they say about future climate changes, that is, climate change that
will be happening starting tomorrow, may be bigger than any other abrupt
climate change that has ever occurred that we have a record for. This
includes the 65 million year ago extinction event that put an end to the
dinosaurs.
So, what is happening in the Arctic? Ice that forms in the Arctic only
stays there for four or five, maybe six years. Then it is forced out
into the far north Atlantic (the Barents Sea) and melts. The Arctic
Ocean currents, which never stop pushing ice around, simply flush the old
ice out to the warmer non-polar sea. This happens every year, as it has been
happening for over
14 million years.
Every year, the Arctic ice pack melts around
the edges. New ice forms about
six feet thick the first year, but forms more slowly subsequent years to
reach a
maximum thickness of about twelve feet. What we have been seeing happening in
the Arctic - how we are losing so much ice volume, and how we continue to
lose ice volume, even as ice coverage does not continue to fall, is that we
are losing the multi year sea ice. The thicker ice no longer exists. Every
winter, six and a half feet of ice refreezes from open ocean and then more
than six and a half feet of ice melts in the summer. The thicker ice no
longer exists in large quantities like it once did because there is just too
much melt. The equilibrium has been disturbed.
From the International Polar Year (IPO) Science Conference in Oslo in
June comes a report by Dr. David Barber, Professor of Environment and
Geography, Canada's Research Chair in Arctic System Science, and director of
the Centre for Earth Observation Science (CEOS) at the University of
Manitoba, Winnipeg. Dr. Barber has been searching for multi year
Arctic sea ice in the Beaufort Sea an area of the Arctic Ocean that stretches
for almost 1,000 miles along the coasts of Alaska and Canada.
Multi year sea ice is that ice that has been around for more than two years.
Over 50% of the Arctic Sea has historically been covered with multi year
ice. Average multi year Arctic sea ice is nearly 12 feet thick (NOAA). First
year ice is around six and half feet thick. Sea ice thickens more slowly as
it becomes older because of the insulation properties of the
overlying ice and the warming effect of the underlying sea. At about 12 feet
in thickness, winter's cold can no longer produce thicker ice.
Research done for the International Polar Year evaluating satellite and U.S.
military submarine sonar estimates of multi year ice thickness by Dr.
Barber and his team of about 200 international researchers, found that within the submarine data release area (covering ~38% of the
Arctic Ocean), the overall mean winter thickness of 3.6 m (11.8 feet) in 1980 can be
compared to a 1.9 m (6.2 feet) mean during the 2008/9 winter of the ICESat (satellite)
record - a decrease of 1.7 m (5.6 feet) in thickness. This combined submarine and
satellite record shows a long-term trend of sea ice thinning over submarine
and ICESat records that span three decades.
Barber's cruise through the Beaufort Sea in the ice breaker Amundsen never did find that multi year ice. In-fact, the ice he did find was
so rotten that it did not impede the forward progress of his ship (see
Geophysical Research Letters -
Perennial pack ice in the southern Beaufort Sea was not as it appeared in
the summer of 2009). This
came as a great surprise to the good professor and as he cruised through the
rotten ice of the Beaufort sea at 24 km/hr (the top speed of his vessel in
open water is 25 km/hr). The Amundsen was designed to break one meter thick
sea ice at 5.5 km/hr. The ice they found was so rotten that the Amundsen
could break 6 to 8 meters (19 to 26 feet) of rotten multi year ice at 9.3
km/hr (5.5 mph).
You see, the satellite microwaves that "see" the Arctic sea ice appear to
have a problem. Part of what Dr. Barber was doing in the Beaufort Sea is a
normal part of science everywhere. He was verifying the remote sensing data.
This data said that the Beaufort Sea was full of thick first year and multi year ice. This kind of ice is a
significant impediment to icebreakers. They can
move through it, but not very quickly.
Have you ever tossed a rock out onto a frozen pond in early spring?
You know the ice is unsafe, but it looks like it could still hold you up.
Yet that fist sized rock you lobbed up in a pop-fly to short left field
punches through eight inches of ice like it was a wet paper towel. What
Barber found in the Beaufort Sea was a wet paper towel.
So why have we not found out that our microwave satellites are not seeing
what we think they are seeing? The reason is likely that these kind of
conditions have obviously not happened before, or they were not happening
when these instruments were first confirmed - before they were sent into
space. Obviously again, we have not approached an ice free Arctic in 14
million years. could these conditions be a precursor to an completely ice
free Arctic?
A story in Reuters says it well: "In November last year Barber spoke shortly after returning from an
expedition that sought - and largely failed to find - a huge multiyear ice
pack that should have been in the Beaufort Sea off the Canadian coastal town
of Tuktoyaktuk. Instead, his ice breaker found hundreds of miles of what he
called "rotten ice" - 50-cm (20-inch) thin layers of fresh ice covering
small chunks of older ice. "From a practical perspective, if you want to
ship across the pole, you're concerned about multiyear sea ice. You're not
concerned about this rotten stuff we were doing 13 knots through. It's easy
to navigate through. I would argue that we almost have a seasonally ice-free
Arctic now, because multi year sea ice is the barrier to the use and
development of the Arctic," said Barber."
An ice free Arctic in the next decade? How about, for all intents and
purposes, an ice free Arctic today?
http://climateprogress.org/2010/09/08/arctic-sea-ice-history-paleoclimate-polar-amplification/
History of Arctic Sea ice
Maslowski Presentation - March 2010
White, et. al., Past rates of climate change in the Arctic, Quaternary
Science Reviews, July 2010
Arctic Sea Ice
Report Card NOAA
PIOMAS, Polar Science Center, University of Washington
International Polar
Year, Oslo Science Conference
Reuters - Multiyear Arctic ice is effectively gone
University of Manitoba News release - Dr. Barber and Sea Ice
September 5, 2010 Near Future West Antarctic Ice
Sheet Collapse" Foretold by Paleo Antarctic Sea Creatures
The scientists who made the discoveries concerning these sea creatures made
this assertion, not me - "Near future West Antarctic Ice Sheet Collapse." It could happen in a few years,
a few decades, or a
century or more, but unless we get our collective climate change mitigation acts together, it will
happen. It has likely even already started with the "unhinging" of the Pine
Island Glacier from its subsea mountain restraining point (see
here).
Today we are as warm as we have been or really
close, for at least three million years, and we are changing our atmosphere far faster
today than at anytime in the last 65 million years (see
here), so if the WAIS collapsed in the past three million years, it's
going to do it again, and soon in geologic time.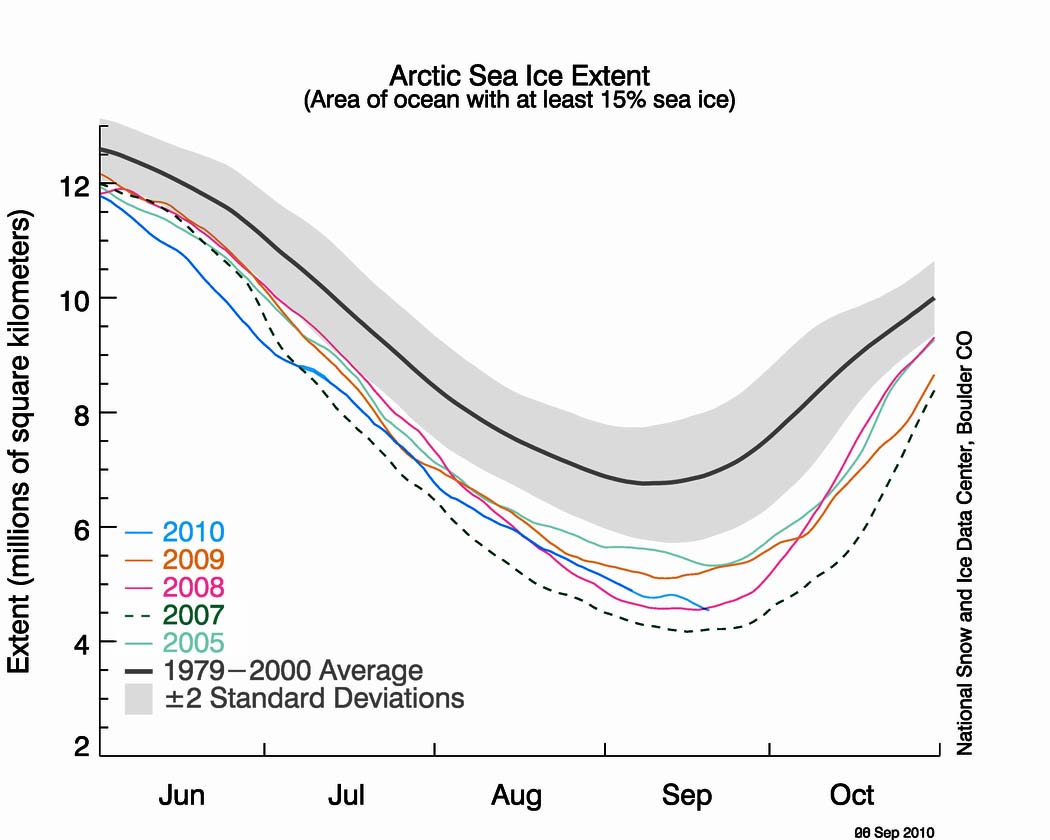
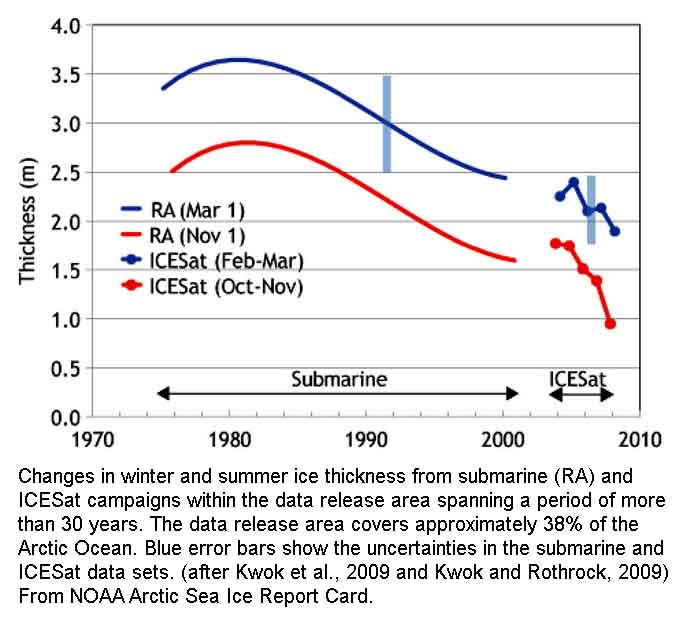
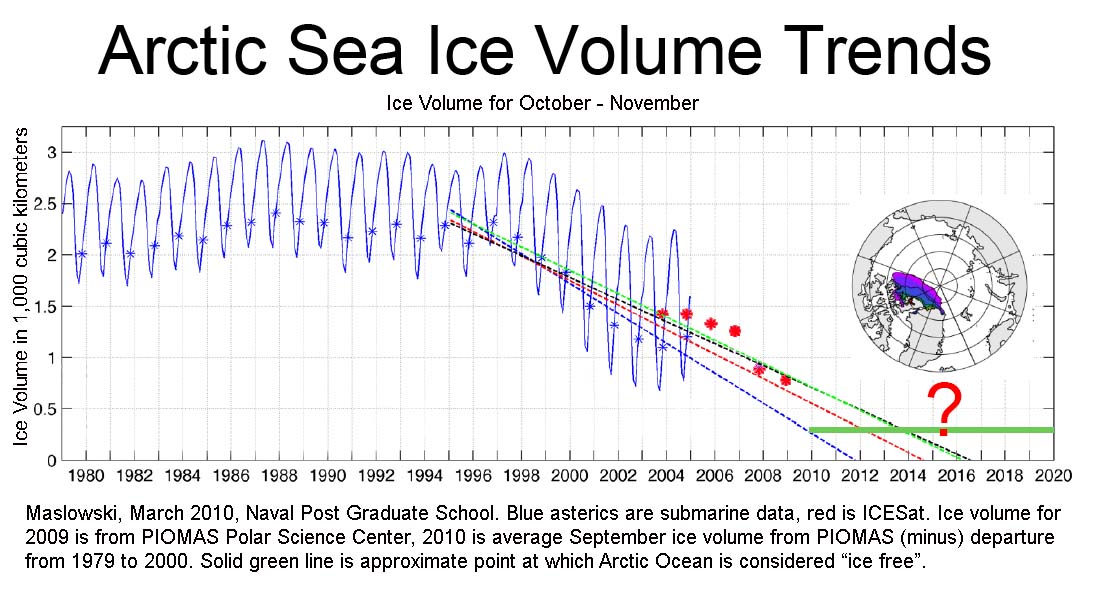
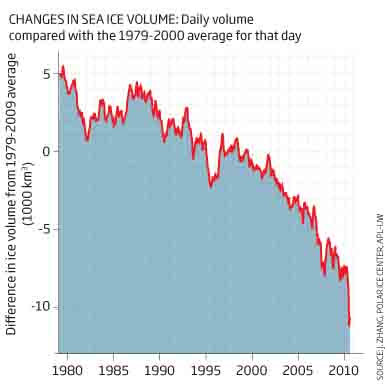
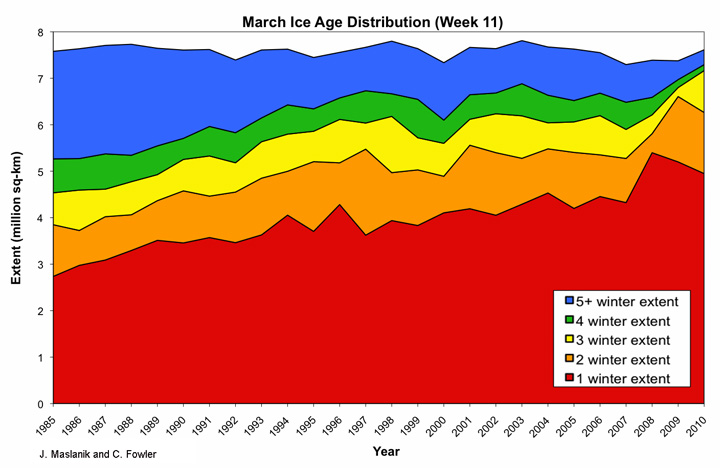
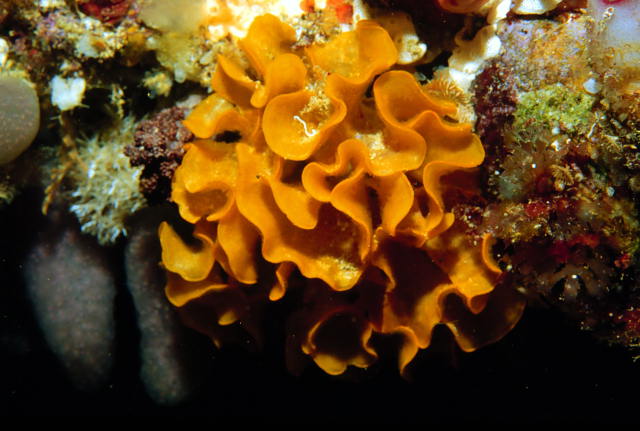
This study shows that the West Antarctic
Ice Sheet was absent 120,000 years ago during the last interglacial warm
period (the Emian). The subject of the investigation was a class of ocean
plant called bryozoa. These Sometimes colorful plants are like the
lichens of the sea. The are mainly found attached to rocks, and their seeds
don't travel far.
Because these plants don't move around much (their seeds
fall to the ocean floor fairly rapidly) the
distribution of individual species is relatively limited. So, what is
found on one side of the Antarctic continent would not be found on the other
if millions and millions of years separated the times when the WAI melted.
There would just be too much opportunity for genetic variation and different
species would evolve.
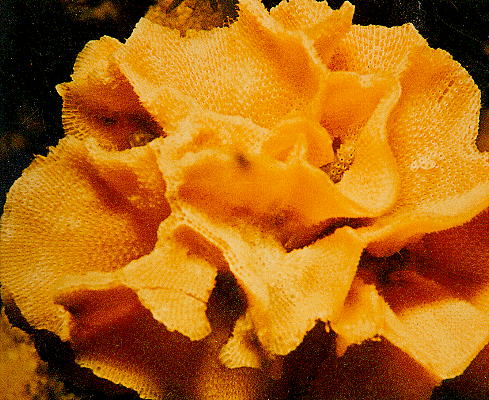
The scientists found the same species of
bryozoa on both sides of the continent: in the Ross Sea and in the
Weddell Sea across what is now 1,500 miles of ice.
This area is covered by the West Antarctic ice
sheet now, it rises several thousand feet above sea level, and extends to
the sea floor several thousand feet below sea level.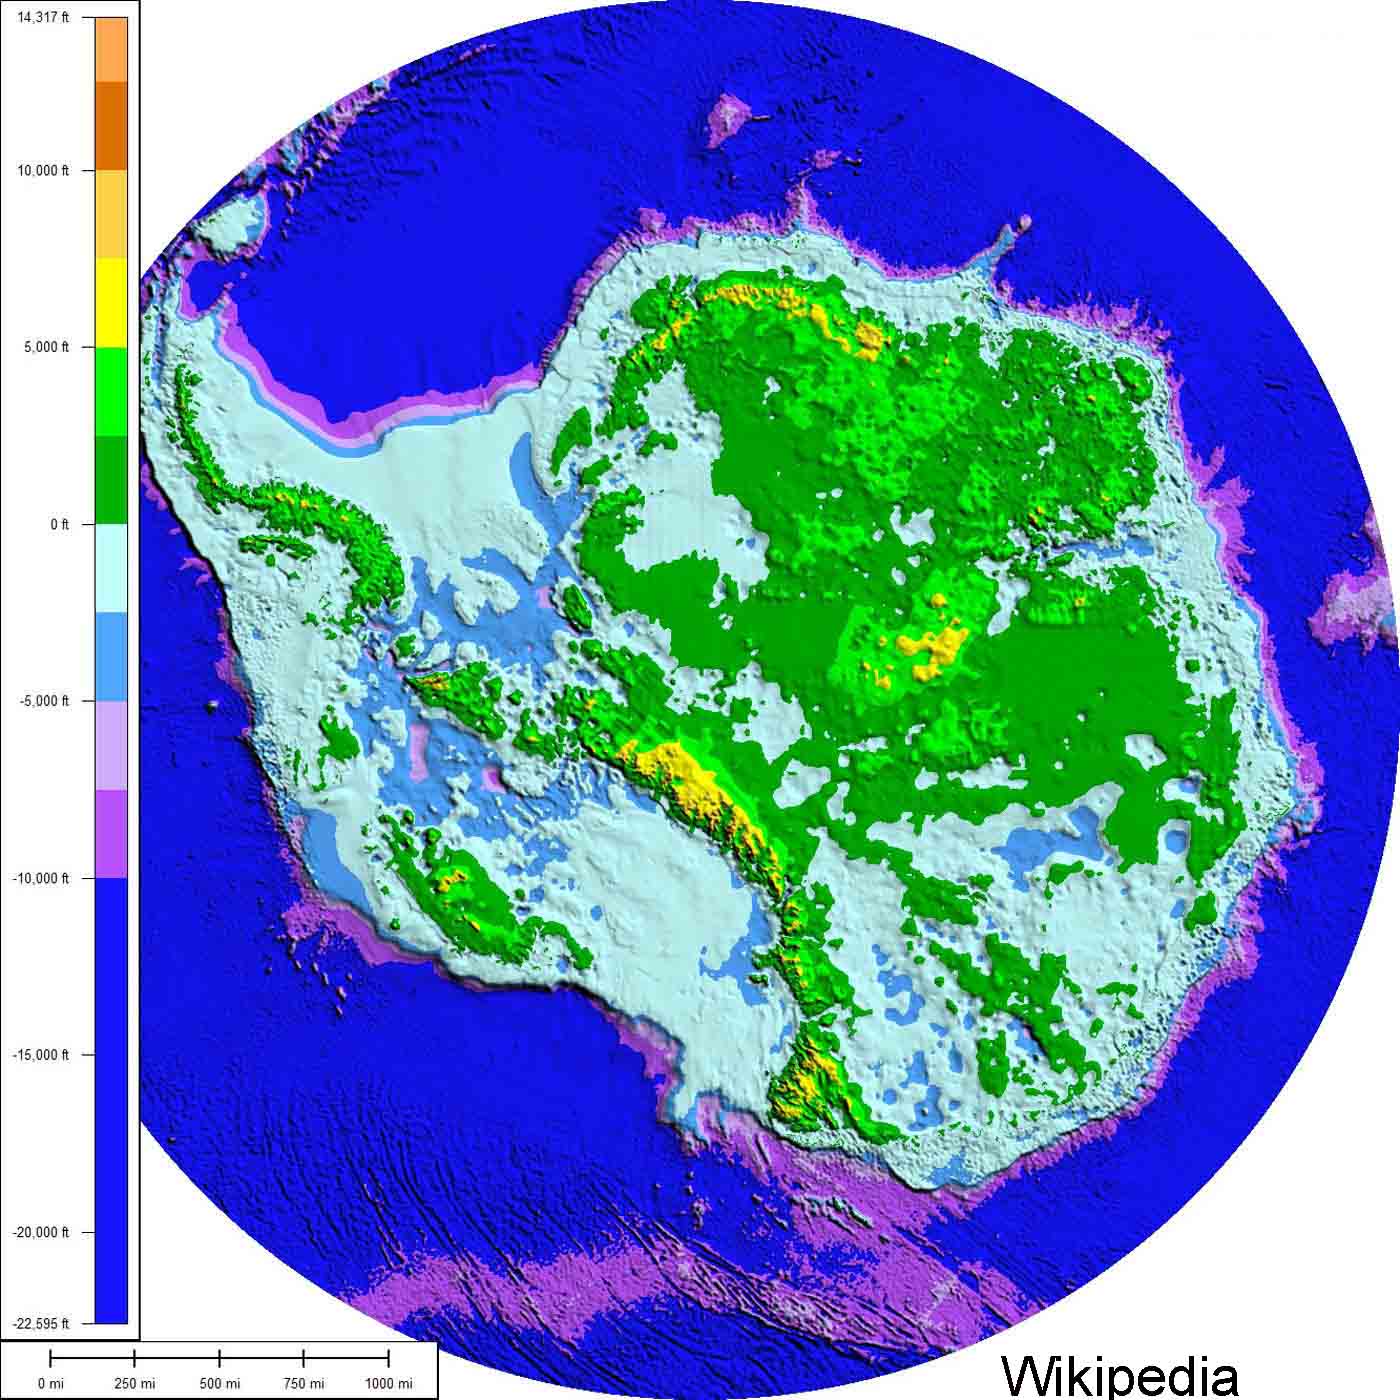 But at the furthest reaches of the ice, furthest away from the south pole,
the massive ice shelves float. Beneath these ice shelves and seaward is
where the bryozoan life forms were found.
But at the furthest reaches of the ice, furthest away from the south pole,
the massive ice shelves float. Beneath these ice shelves and seaward is
where the bryozoan life forms were found.
Temperatures were quite similar then as today, only back then and the researchers say that in order for these bryozoans to get be in both the Weddell sea and the Ross sea, that a trans-Antarctic seaway must have been open - meaning that the West Antarctic ice sheet must have melted, or collapsed.
Today there is no end in sight to the warming of course
and the warming that we have been experiencing for the last 30 years will only
accelerate, at least to the point where we are bout 3 degrees C warmer than
today - meaning three degrees warmer than 120,000 years ago. This will
happen in the next 50 to 100 years. The West Antarctic ice sheet
doesn't have a chance.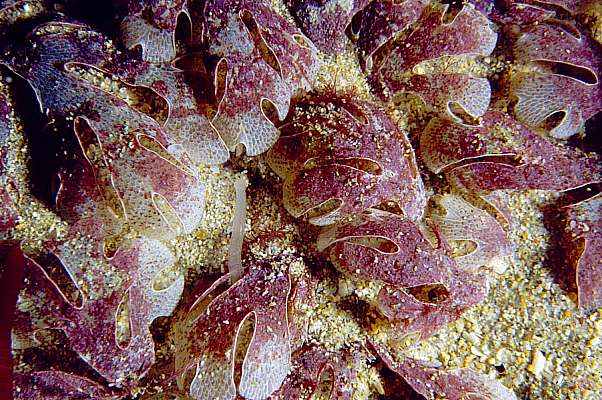
Some geological evidence suggests that the West Antarctic Ice Sheet collapsed at least once in the last million years, but /this information points to possibly more collapse events.
Collapse of the West Antarctic Ice Sheet would raise global sea level by 17 to 21 feet. There is geologic evidence for sustained sea level rise of a sea level rise event of 10 feet in less than 50 years that occurred about 120,000 years ago (see here). The paper mentions that some scenarios of future climate change predict a collapse within the next two centuries. The researchers investigated three scenarios by which these bryozoa could have become distributed as they have been and they say "Surprisingly, we found most similarity between two areas which are not currently connected – the shelves of the Weddell Sea and Ross Sea."
The paper's abstract ends "Current rates of warming are exceptional compared with the near past glacial cycles so our study, the strongest faunal evidence of WAIS collapse during the recent geological past, thus supports predictions of a near future WAIS collapse (with considerable global sea level implications) and resultant future major faunal exchanges."
July 29, 2010 Earth's Oxygen Generator is
Failing - Ocean Primary Productivity Down 40% Since 1950 Primary productivity is phytoplankton.
Phytoplankton are the bottom of the food chain. All life in the oceans
depends on phytoplankton. They sequester tremendous amounts of carbon in the form of
calcium carbonate in their tiny little shells.
Primary productivity in our oceans is also responsible for the generation of
half of the oxygen in our atmosphere.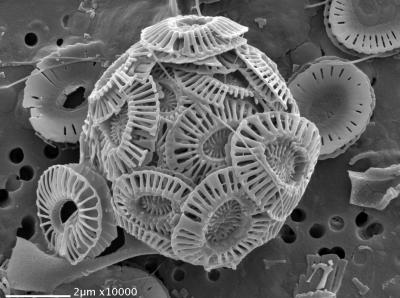
But this study was not about oxygen, it was about phytoplankton - algae,
diatoms, dinoflagellates,
coccolithophores and such. The main plant form in our
oceans. They make the oceans murky, sometimes green, sometimes red, often
blue. it is actually the coccolithopores that make the ocean blue. The
scientists can tell how many phytoplankton organisms are in the ocean by its
clarity. As the ocean gets more murky, there are more phytoplankton.
The determination uses what is called a secchi disc. This disc is painted
white and black and is lowered into the water until it can no longer be
seen. They use a 20 cm disc for short distances and a 100 cm disc for really
clear deep water. The record in the Weddell Sea, off of Antarctica is
262 feet.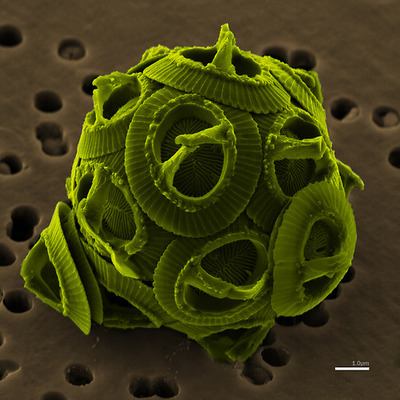
Nearly 500,000 secchi disc readings were used to evaluate the way that
ocean clarity has changed since 1900. The results show that warming
temperatures are significantly responsible for ocean clarity changes in 8
out of 10 global oceans. They can tell this because of the relative changes
in different types of phytoplankton and zooplankton. Some of the changes
could be due to fishing practices or ocean current changes, but when looking
at the different species of microscopic and other small primary productivity
organisms, it is clear that the warming signature plays a vital and primary
role.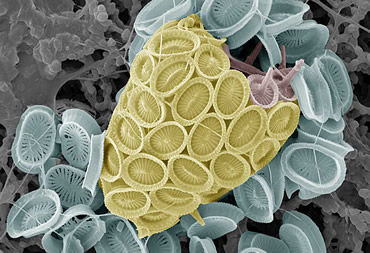
The research team showed that phytoplankton has been decreasing by a rate of about one per cent per year, for the past 110 years. While this might not seem like a large number, this translates into a decline of about 40 per cent since 1950. While one percent per year for 110 years is more than a 60% decline, and this is just what the data show, the press release only suggests 40% for the last 50 years. This number is valid if we do the math - one percent decline each year for 50 years, but why not 64%, as the math for 110 years would suggest?
It has to do with the "robustness" of the data. There have been many
more secchi disc evaluations of ocean visibility in the last 50 years than
in the previous 60 years. The authors state the following in the
conclusions of their report: "The long-term global declines observed
here are, however, unequivocal. These results provide a larger context for
recently observed declines in (phytoplankton) and are consistent with the
hypothesis that increasing ocean warming is contributing to a restructuring
of marine ecosystems, with implications for biogeochemical cycling, fishery
yields, and ocean circulation."
What does this mean? . . . restructuring of marine ecosystems? Phytoplankton
are not called primary productivity for nothing. They are the bottom of the
food chain. Everything living, and many things not living depend on primary
productivity; . . . implications for biogeochemical cycling? This is
carbon sequestration plain and simple. Many other biogeochemical (love
that word) things are of course impacted if we have primary productivity
changes, like the amount of oxygen in our atmosphere ( ! ), but little in
the literature yet addresses this topic. There are plenty of articles
out there though that do talk about primary productivity and carbon
sequestration. This is where half of carbon is taken out of our
atmosphere - in primary productivity in the oceans. A decrease in primary
productivity means more carbon dioxide stays in our skies. This is another
of those nasty positive feedback mechanisms that increases warming all by
itself.
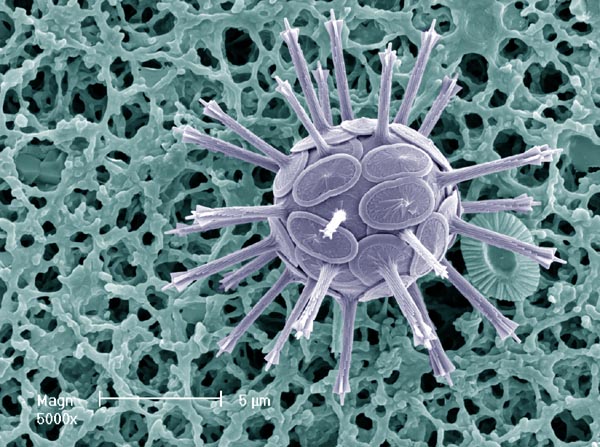
Then there are fisheries yields. If primary productivity decreases,
and primary productivity is the bottom of the food chain - everything that
eats suffers. And finally, ocean circulation: Ocean currents bury CO2.
Warming, caused by the decreasing primary productivity feedback, increases
stratification, or it decreases the strength of ocean currents. This in turn
decreases the amount of carbon dioxide that can be carried to the depths to
be discharged as sediment and buried on the ocean floor.
So, all-in-all, this is a really, really big deal folks. We can not be fooling with the fundamental building blocks of life on this planet. Implications are immense.
This brings me to oxygen generation. As previously stated - ocean
primary productivity accounts for half of the oxygen generated on earth..
Plants on land account for most of the rest, with soil and rock weathering
processes and cosmic rays chemical processes being responsible for a few
percent. We have reduced the primary productivity of our oceans by 40%
for sure, and by as much as 64% possibly. This means that oxygen generation
on earth has been reduced by 20% or 32% respectively. Bad news.
Again, I have not seen any papers on this yet, but in combination with the decline in productivity of the Earth's forest biomass, this topic is one that is not long to be out of the academic presses. Remember, it takes years and years for research to make its way through the labyrinths of academia and into the journals. This is all brand new science. Many - many climate scientists have no idea that this is happening, let alone non-specialists, the media, our leaders and everyone else.
About the images: these images were taken with an electron microscope - these little plants are tiny, really tiny. In round numbers, there are about 5,000 known species of phytoplankton.
Press Release: Phytoplankton in retreat, Dalhouse University
Boyce et. al., Global Phytoplankton decline over the past century, Nature, July 2010
August 25, 2010 Mining Carbon from the Sky - 350 ppm CO2e - Beyond Emissions Reductions:
50 ppm for $10 trillion Hansen 350, Democracy Now - 8 years of bush, Iraq Afgahnistan, bailouts http://www.democracynow.org/2008/12/22/linda_bilmes_the_10_trillion_hangover
August 14, 2010 Climate is Changing and It's Our Fault - Prove it say the Conservatives: Trouble is, it has Been Proven Thousands and Thousands of Times Benoit Thibodeau and his team have a new study of foraminifera from the St. Lawrence Estuary in Canada. One of what is certainly hundreds, and possibly thousands of studies of this most common of ocean temperature proxies. This one just looked at a thousand years of history, but found that this location tracked exactly like the rest of them - right there along the same old track as the vast majority of the rest of the temperature proxies of the "hockey stick". So, what am I writing about here?
There is a clue in the way I titled this piece. I had a long talk over a fabulous cigar a couple of weeks ago with an old friend. My friend is a bank president, he is not rich, but he's doing well. He's quite conservative, but he has a good head on his shoulders. He always has good questions for my about climate change, and we always very meaningful discussions about politics, the environment and even religion. class="style92"> But I always come up against the same brick wall with climate change - my friend says (repeatedly) "If only someone could just prove that climate is changing . . . or prove that man is to blame . . ." What I have to report about the latest from academia simply has no meaning to this bank president. He considers everything I say quite thoroughly, asks follow up questions, then restates the talking point. "If only the scientists could just prove it". Then, he usually repeats another thing he says often when we talk (we don't get to talk but couple times a year). this other thing he says is " I am no climate scientists, but it seems to me that , if climate change was real, it would be all over the media and everyone would be freaking out, etc. "
Now, I live in Austin which is a liberal pocket, a small liberal pocket, in the vastly conservative state of Texas. I have family here, and old friends. Most of new friends (the last 25 years), are progressive, but old friends are hard to come by, so I keep them regardless of politics. Family members too, they are all conservative, some greatly so, the close family anyway. And they are ALL like this. I don't like to bring my personal life into this issue, but Thibodeau's paper, more precisely his abstract, reflected a tone that is showing up more often in climate science today.
Five years ago, scientist stuck to their job, stated the facts, talked about methods and made conclusions. But today, many academic works are talking about the perceived controversy in climate science. They are attempting to make policy statements, trying to justify the reasons for such a bad understanding of climate science by non-scientists. This controversy of course is between the un-scientists and themselves. Scholarly types even have a complete line of reasoning to help understand this kind of behavior.
It's called the Kruger Dunning Effect. Not only are many folks (and leaders, and politicians) out there unaware that they do not have the knowledge to make appropriate decisions, but this lack of knowledge gives them a false sense of knowledge - Pretty damn scary really. If climate science is a good indicator of the number of people inflicted with symptoms of the Krugger Dunning Effect . . .what other world issues are suffering from the impacts of unknown unknowns?
Kruger and Dunning, Unskilled and Unaware of it How difficulties in recognizing ones own, Journal of Personality and Social Psychology, 1999. And redone on 2009, Here.
July 24, 2010 June 2010 Temperature Was the 304th Consecutive Month Above Average It has been 25 years and four months since the globally averaged monthly temperature was below the 20th century average. The last time the monthly temperature was below average was February 1985.
NOAA National Climatic Data Center, Global June Analysis 2010
July 20, 2010 Expert credibility in climate change, Proceedings of the National Academy of Science, April 2010 - Almost 98% of Climate Scientists Support IPCC's Platform of Anthropogenic Climate Change AND, Contrarian Experts are by no Means "Experts"
Abstract: Although preliminary estimates from published literature and expert surveys suggest striking agreement among climate scientists on the tenets of anthropogenic climate change (ACC), the American public expresses substantial doubt about both the anthropogenic cause and the level of scientific agreement underpinning ACC. A broad analysis of the climate scientist community itself, the distribution of credibility of dissenting researchers relative to agreeing researchers, and the level of agreement among top climate experts has not been conducted and would inform future ACC discussions. Here, we use an extensive dataset of 1,372 climate researchers and their publication and citation data to show that (1) 97–98% of the climate researchers most actively publishing in the field support the tenets of ACC outlined by the Intergovernmental Panel on Climate Change, and (ii) the relative climate expertise and scientific prominence of the researchers unconvinced of ACC are substantially below that of the convinced researchers.
July 19 , 2010 Worst Coral Reef Bleaching in Recorded History - will happen this year. Worse than 1997-98 during the big Super El Nino, only this year - El Nino ended last spring. But that has not stopped global ocean waters from being hot enough to boil coral.
It happens when average water temperatures during the summer months warm one degree. That's all it takes, just one degree of warming and coral reefs the world over die. That is all it took during the great super El Nino, but now, it's just plain old global warming that is to blame.
The National Oceanic and Atmospheric Administration's Coral Reef Watch, said: "The bleaching is very strong throughout south east Asia and the central Indian Ocean. Significant bleaching has been reported in Maldives, both sides of the Thailand Peninsula (Andaman Sea and Gulf of Thailand), Cambodia, Indonesia, and the Anilao region of the Philippines and the west coast of the Philippines. Bleaching was observed in the southwest and northeast Madagascar earlier this year.
Coral reef monitoring teams have reported mass bleaching of coral reefs off the coast of Malaysia, Vietnam, Cambodia and Indonesia while, Sri Lanka and reefs off the coast of east Africa have also been hit. In the eastern South China Sea bleaching has been reported. class="style92"> Bleaching began at the beginning of May in the eastern Caribbean and now covers most of the southern Caribbean Sea. The worst bleaching events ever in the Caribbean in 1998 and 2005 did not start this early.
In 1998, 16 percent of the World's reefs were killed in the worst bleaching event ever recorded. This year has started off earlier and more extreme, and we have no el nino event now. The warming has caught up with us
In April 2009, the World's oceans crossed the threshold to become the warmest that it has been since record keeping began in the late 19th century. (see here)
Coral Bleaching Thermal Stress Outlook
http://coralreefwatch.noaa.gov/satellite/bleachingoutlook/outlook_messages/bleachingoutlook_20100608_for_2010junsep.html
July 15, 2010 Five Big All-time Global Climate Records Broken in June: Temperature, Temperature, Temperature, and Arctic and Antarctic Sea Ice: NOAA reports that June, April to June, and the Year-to-Date Global Temperatures are the warmest on Record. Last month’s combined global land and ocean surface temperature made it the warmest June on record and the warmest on record averaged for any April-June and January-June periods.
Arctic sea ice covered was 10.6 percent below the 1979-2000 average extent and the lowest June extent since records began in 1979. This was also the 19th consecutive June with below-average Arctic sea ice extent. But, look - Antarctic sea ice extent in June was 8.3 percent above the 1979-2000 average, which made it the largest June extent on record. How did we get the smallest Arctic and the Largest Antarctic extents records ever?
Climate change of course. As counter-intuitive as it sounds, We have finally locked down one of the main reasons that Antarctica's sea ice has been growing (see here). There are a number of reasons actually, but the biggest today seems to be the ozone hole. What it is doing is increasing winds in Antarctica and lowering the level of the Stratosphere. this bring the cooler air of upper atmosphere closer to the earth's surface which allows more mixing and colder temperatures.
But here's the problem with this theory. Antarctic temperatures have not dropped. They have warmed. Not as much as the world average, or near as much as the Arctic, but they have not dropped. (This diminished warming in the Antarctic is completely supported by the climate models. the ocean around Antarctica moderates its climate and keeps it from warming, whereas the Arctic is surrounds by land, which accelerates warming.) Temperature however is not the only thing that can increase the freezing of sea water. The higher winds increase cooling of the ocean surface. This allows two other things going in the Antarctic to increase the extents of sea ice.
Ice discharge in Antarctica has increased to about the level that we are seeing in Greenland. these extra icebergs melt quickly and decrease the salinity of Antarctic Ocean surface water. Less salinity allows the water to freeze at a higher temperature. (Normal sea water freezes at about 28.4 degrees F.)
The final thing is a feedback effect. More sea ice decrees the amount of mixing of surface waters because once the surface freezes the wind can't move the water around, which is responsible for mixing the less salty water at the surface with the more salty water below. So the lack of mixing keeps the surface waters less salty, allow freezing to occur at a higher temperature. (see here)
July 10, 2010 If Only This Were The End of It From a Grist post: " . . . The Muir investigation is the third independent evaluation in Great Britain to confirm the credibility of the scientists and accuracy of the science discussed in the stolen emails and posted online on November 20. The conclusions of the Muir panel, moreover, come less than a week after an investigative panel at Pennsylvania State University confirmed the quality of the climate science prepared by Michael E. Mann, a climatologist at Penn State University, and the author of a number of the email messages hacked from East Anglia University's data bank. In February, a separate Penn State panel concluded there was "no substance" to allegations of impropriety made by opponents of climate action, and that Dr. Mann's scientific practices, ethics, research, and conduct were not in dispute. "We can now put this bogus, manufactured scandal behind us, and move on to a more constructive conversation about climate change . . . "
http://www.grist.org/article/science-vindicated-as-senate-edges-closer-to-climate-and-energy-debate/ Don't Let the Climategate Hit You on the Way Out - by Keith Schneider
July 8, 2010 In the Western North America, The Worst Drought Since 1951 Will be Repeated Three to Five Times by 2030 One of the authors of this study says: "Frankly, I was expecting that we'd see large temperature increases later this century with higher greenhouse gas levels and global warming . . . I did not expect to see anything this large within the next three decades. This was definitely a surprise."
The IPCC "likely" scenario says that the earth will warm by 1.8 degrees C by 2039 (3.6 degrees F). The extensive increases in heat waves and extreme temperatures in the modeling do not reflect that CO2 concentrations are increasing as rapidly or even more rapidly than the worst case scenario (see here).
The title of this discussion is bad enough, but we all have to remember that
most of the climate studies today are being performed with IPCC model
scenarios, this study included. The IPCC model scenarios are
significantly conservative as has been shown by current impacts of climate
change consistently
 happening faster and with more extreme impacts than the
models had predicted. The graph "Global CO2 Emissions - Worst Case
Scenario IPCC Models vs. Actual Emissions" shows actual CO2 emissions are
higher than the IPCC A1F1 scenario. The A1F1 (the red line) is the highest
emission scenario that the IPCC considers. In effect, this is the worst
case scenario. Actual CO2 concentrations, from data from both major sources
in the climate community (the black lines) is higher than the A1F1 worst
case scenario.
happening faster and with more extreme impacts than the
models had predicted. The graph "Global CO2 Emissions - Worst Case
Scenario IPCC Models vs. Actual Emissions" shows actual CO2 emissions are
higher than the IPCC A1F1 scenario. The A1F1 (the red line) is the highest
emission scenario that the IPCC considers. In effect, this is the worst
case scenario. Actual CO2 concentrations, from data from both major sources
in the climate community (the black lines) is higher than the A1F1 worst
case scenario.
What does this mean? In the short term, and especially with the way that Greenhouse gas regulations ore going on Earth today, this trend will continue. And by the short term, I mean climatologically. This short term would be for at least the next decade. Remember, the time frame for climate discussions, the amount of time that it takes something to happen with climate - including emissions mitigations effects - starts in decadal time.
Now the big trouble with not acting quickly on regulating greenhouse gases of course is feedback mechanisms. The longer we wait to react, the greater the impacts that feedback mechanisms will have. This means that our efforts to control global warming will need to be greater than we have anticipated if we continue to delay action.
Compounding this concept, the track record of the world for addressing climate change through greenhouse gas mitigation is appallingly bad. We have almost universally not met Kyoto goals, or flatly refused to acknowledge the Kyoto protocol in the case of the largest greenhouse gas polluter, far larger than China - the United States.
Greenhouse gases warm the atmosphere. Greenhouse gas emissions only incrementally add to the greenhouse gas burden. Our annual emissions, relative to the load of greenhouse gases in the atmosphere that is actually doing the warming, are exceedingly small.
In fact, greenhouse gas emissions cuts promised by the developed world by 2020 to 2030 amount to only one half of one percent of the load of greenhouse gases in our atmosphere that are actually doing the warming. The chance that the world will make greenhouse gas emissions cuts that make a difference in the short term ( climate change short term) is almost zero.
What this means is that our emissions will continue to outpace the worst case IPCC scenario and that difference, unless we make extraordinary emissions cuts much sooner than it appears anything will happen, will continue to grow.
Looking at Diffenbaugh and Ashfaqs paper in Geophysical Research Letters, they say that the longest heat wave that occurred between 1951 and 1999 will happen three to four times between 2010 and 2020. These heat waves will increase in the 2020 to 2030 decade happening 8 times in the American West and 4 times in the East. The paper also notes that there will be increased variance in the north central U.S.
The 95% temperature exceedance, that is the number of days that will be
hotter than it is
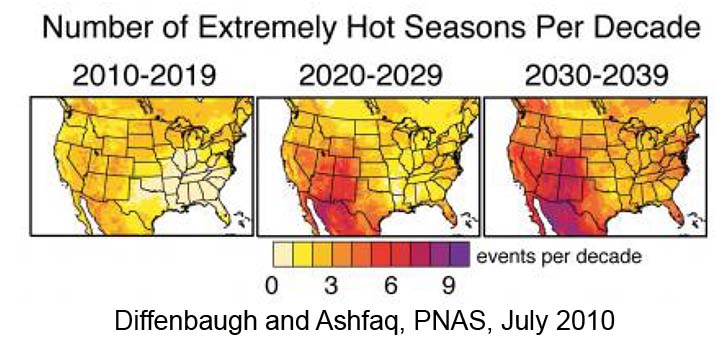 during
the hottest five percent of the year (18 days), during the decade 2020 to
2039 will be exceeded 30 over most of the nation and in Texas to 52
days. Which is to say that the number of extremely hot days will more than
double.
during
the hottest five percent of the year (18 days), during the decade 2020 to
2039 will be exceeded 30 over most of the nation and in Texas to 52
days. Which is to say that the number of extremely hot days will more than
double.
Based on their work, Diffenbaugh and Ashfaq tell us that dangerous global warming could occur before the commonly accepted 2 degrees C threshold is met. But most alarming, the authors stick to the old science. They do not start their models at today's concentrations of greenhouse gases, nor do they consider the world's trajectory of increase since the A1B scenario was formulated in 2000 with the third IPCC Report.
The A1B scenario uses CO2 emissions that are 4 percent greater than the average, so it is a worse than usual case to start with. But the actual emissions today are twice as bad as the A1B scenario, and do I need to say it again - worse than the worst case scenario.
The report paper ends "...the response to a given GHG stabilization target is likely to be greater than to the equivalent concentrations within the [modeling] tested here. Although accurate decadal-scale climate prediction represents a significant challenge (e.g., [Meehl et al., 2009]), the intensification of hot extremes reported here suggests that constraining global warming to 2 °C above pre-industrial conditions may not be sufficient to avoid dangerous climate change."
Diffenbaugh and Ashfaq, Intensification of hot extremes in the United States, Geophysical Research Letters, July 2010, (in-press).
Diffenbaugh and Ashfaq, Intensification of hot extremes in the United States, Geophysical Research Letters, July 2010
June 21, 2010 Why Don't the Contrarians Have
Studies - Reaffirming
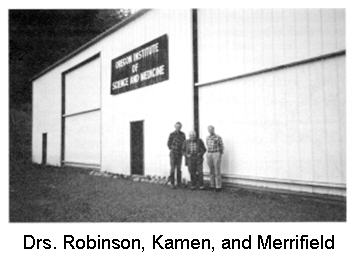 that
Climate Change is Bunk - Repeatedly Published in Academic
Journals? A
new study in the Proceedings of the National Academy of Science (here) says
that, overwhelmingly, contrarians scientists are underwhelming qualified
to be influencing anyone on climate change issues. But to give them credit,
they do have their flagship: 30,000 scientists says that climate change is
bunk: the Oregon Institute of Science and Medicine.
http://www.oism.org/ They are more
embarrassing than the misspellings on this website. See for yourself. Their website seems to have one link to a
scientific work, a few links to climate non-science, a link to homeschool
curricula, one to children's books, one to spiritual music and six links to
Civil Defense and Nuclear attack survival. This is the Institute and
three of the seven faculty, one of whom listed is dead. Don't get me wrong.
I am not knocking anything these folks do. I do find it exceedingly
difficult
to understand how their work can be used as a fundamental part of the
contrarian denial platform.
that
Climate Change is Bunk - Repeatedly Published in Academic
Journals? A
new study in the Proceedings of the National Academy of Science (here) says
that, overwhelmingly, contrarians scientists are underwhelming qualified
to be influencing anyone on climate change issues. But to give them credit,
they do have their flagship: 30,000 scientists says that climate change is
bunk: the Oregon Institute of Science and Medicine.
http://www.oism.org/ They are more
embarrassing than the misspellings on this website. See for yourself. Their website seems to have one link to a
scientific work, a few links to climate non-science, a link to homeschool
curricula, one to children's books, one to spiritual music and six links to
Civil Defense and Nuclear attack survival. This is the Institute and
three of the seven faculty, one of whom listed is dead. Don't get me wrong.
I am not knocking anything these folks do. I do find it exceedingly
difficult
to understand how their work can be used as a fundamental part of the
contrarian denial platform.
The Anderegg study of "...1,372 climate researchers and their publication and citation data to show that 97–98% of the climate researchers most actively publishing in the field surveyed here support the tenets of ACC (anthropogenic climate change) outlined by the Intergovernmental Panel on Climate Change, and the relative climate expertise and scientific prominence of the researchers unconvinced of ACC are substantially below that of the convinced researchers." The author states "...the bulk of (skeptical) researchers on the most prominent multisignatory statements about climate change have not published extensively in the peer-reviewed climate literature."
Anderegg et. al., Expert credibility in climate change, PNAS June 2010
Carbon Dioxide Concentrations Today are Double What We Thought
The further along we move into the 21st century, the more astonishing the climate discoveries become. New discoveries have shown that atmospheric CO2 in paleo times was only one third as high as we thought. What was a huge consensus in climate science that understood that atmospheric CO2 was, at its highest, at any time on earth, around 3,000 ppm has been stood on its head in a way that has serious fundamental implications for the risks associated with climate change.
http://www.palaeos.com/Paleozoic/Ordovician/Ordovician.htm
Between 65 and 300 million years ago, during
the Permian and Mesozoic greenhouse climate eras. The new discoveries have
come from two places now. Originally, these 3,000 ppm CO2 concentration
analysis came from dirt. Soil specifically, soil carbonate analysis. The
carbon is a proxie, similar carbonate analyses of the tiny and microscopic
shells of ocean primary productivity creatures to help us understand climate
change in more resent times, like the last several millions and tens of
millions of years. One of the new analyses still looks at dirt (soil
carbonate), but this is the 21st century. Scientists, as one would expect,
are more clever today than they were in decades past. They have
refined their techniques of soil carbonate analysis and have found that
atmospheric CO2, during the last 400 million years, was no more than 1,000
ppm. Breeker, et al. states that the warmest period during the Mesozoic (the
warmest period on earth since there were green plants on earth) the highest
atmospheric CO2 concentration was 1,000 ppm.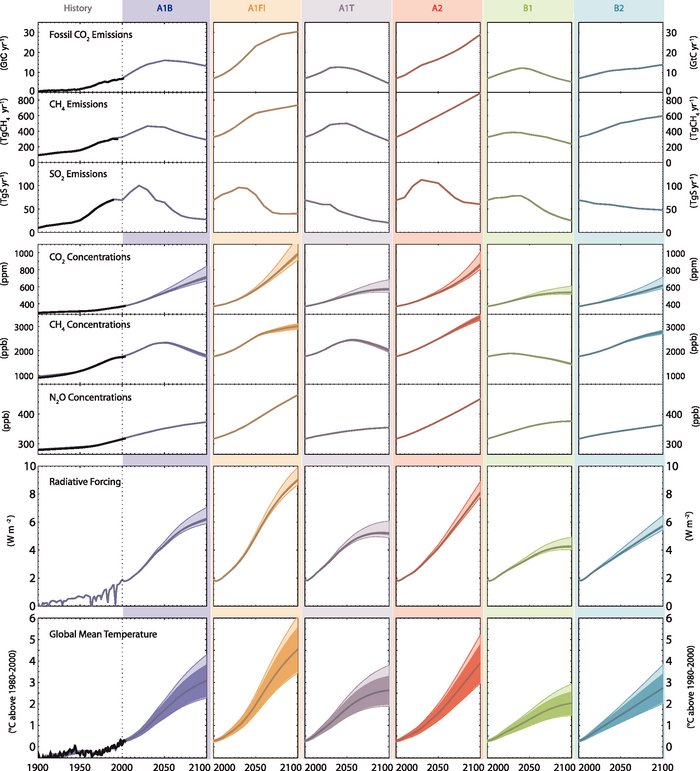
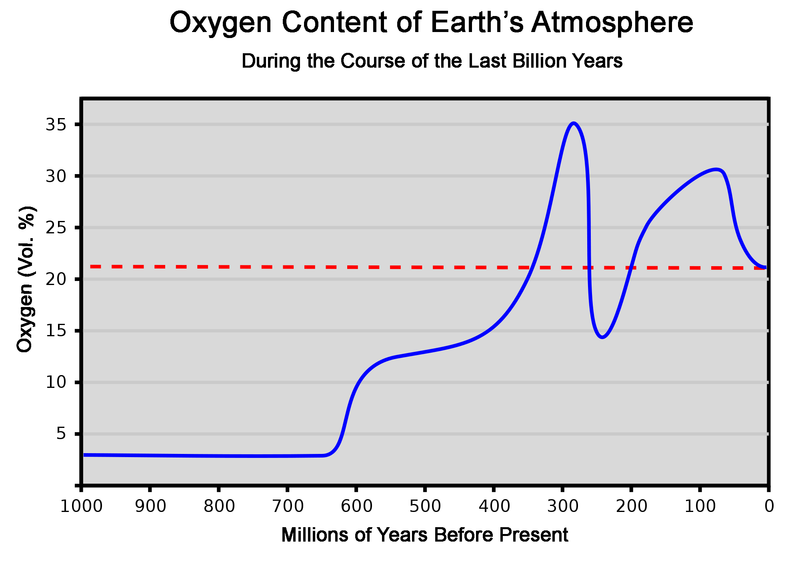
Another thing that the Breeker study has done besides shed light on the real atmospheric carbon dioxide concentration on of earth's history, since there were green plants on land, is that this new study and it's recalibration methodology, has allowed previously disparate paleo historic CO2 proxies to become better correlated.
Breecker, et. al., Atmospheric CO2 concentrations during ancient greenhouse climates were similar to those predicted for A.D. 2100, PNAS, October 2009.pdf
Worst case carbon dioxide concentrations predicted for the year 2100 will match the highest CO2 concentrations on Earth since there has been more than 1.5 percent oxygen our atmosphere. But, this is not the widely held popular understanding, not is it anything acknowledged by the IPCC. This is a big problem with the IPCC and consensus science.
Consensus is about the best science that has been around for a while. And the papers for the Fourth IPCC Report stopped being taken in 2005, so we are talking bout some seriously dated science. An example is reflected in the above statement about CO2 concentrations. It has been widely accepted, since we really started understanding our paleo climate, that back in the days of the dinosaurs and before, CO2 was somewhere around 2,000 ppm.
A study in 2007 and another in 2009 have brought new discoveries into the light that show otherwise. It appears that previous estimates of paleo atmospheric CO2 concentrations were significantly overestimated. It's likely these papers say that the highest CO2 concentrations, an earth with green plants on land, was only about 1,000 ppm (+/-). This means we are much, much closer to the edge than we previously understood.
June 9, 2010 Vegetation Shifting Around the World: From Berkeley press release: Vegetation around the world is on the move, and climate change is the culprit, according to a new analysis of global vegetation shifts led by a University of California, Berkeley, ecologist in collaboration with researchers from the U.S. Department of Agriculture Forest Service. Researchers present(ed) evidence that over the past century, vegetation has been gradually moving toward the poles and up mountain slopes, where temperatures are cooler, as well as toward the equator, where rainfall is greater. The results came from an analysis of hundreds of field studies of observed 20th century climate. The analysis identified field studies that examined long-term vegetation shifts in which climate, rather than impacts from local human activity such as deforestation, was the dominant influence.
The researchers found 15 cases of biome shifts since the 18th century that are attributable to changes in temperature and precipitation. "This is the first global view of observed biome shifts due to climate change," said the study's lead author Patrick Gonzalez, a visiting scholar at the Center for Forestry at UC Berkeley's College of Natural Resources. "It's not just a case of one or two plant species moving to another area. To change the biome of an ecosystem, a whole suite of plants must change." The researchers calculated that from 1901 to 2002, mean temperatures significantly increased on 76 percent of global land, with the greatest warming in boreal, or subarctic, regions.
Some examples of biome shifts that occurred include woodlands giving way to grasslands in the African Sahel, and shrublands encroaching onto tundra in the Arctic. "The dieback of trees and shrubs in the Sahel leaves less wood for houses and cooking, while the contraction of Arctic tundra reduces habitat for caribou and other wildlife," said Gonzalez, a lead author on reports of the Intergovernmental Panel on Climate Change (IPCC). "Globally, vegetation shifts are disrupting ecosystems, reducing habitat for endangered species, and altering the forests that supply water and other services to many people." ... "Scientists had not quantified this risk before," said Gonzalez. "We developed a simple classification system that natural resource management agencies can use to identify regions in greatest need of attention and planning. We have worked with the U.S.D.A. Forest Service and the U.S. Fish and Wildlife Service to explore the application of our results to adaptation of natural resource management." Gonzalez said that because of limited resources, it may be prudent to focus on protecting areas of greater resilience to ecological changes so that they can serve as refuges for plants and animals. "It is also useful to identify places of higher vulnerability, because agencies will need to consider adaptation measures for vulnerable ecosystems," he said. "Some shifts in vegetation could increase fuel for wildfires, for example, so prescribed burning may be necessary to reduce the risk of catastrophic fires." "Approximately one billion people now live in areas that are highly to very highly vulnerable to future vegetation shifts," said Gonzalez. "Ecosystems provide important services to people, so we must reduce the emissions that cause climate change, then adapt to major changes that might occur."
SKAGGS ISLAND, CA (KGO) -- As the gulf leak wears on and on, it has almost upstaged another environmental issue: climate change which it wears on. Local reports in the past two days paint very sobering pictures. For Stephanie Sanchez of Petaluma, this was as good a day as any for capturing a moment in time at Skaggs Island, which is part of an environment influx. "I'm most aware of how every moment changes," she said. That prophetic comment from an artist came on a day when scientists said pretty much the same thing, with data to back it up. "We can expect changes more in accordance with a tropical environment," report author Dr. Bill Sydeman said. Sydeman helped author a report by the National Oceanic and Atmospheric Administration. It looks at the Gulf of the Farallones and concludes that the effects of climate change are well underway in that region. In some places, water temperatures have risen five degrees Fahrenheit in 30 years, causing warm water species to move in, and colder ones to move out. "It's mixed. There are winners and losers. If you're a salmon, you're losing in this battle," Sydeman said. It is another example of the difference between weather, which is short term and climate, which changes over decades. And now we can see that climate is affecting changes inland as well. "If we continue to emit greenhouse gasses, half the state is vulnerable to shifts in the future," Dr. Patrick Gonzales from UC Berkeley said. Gonzales expects that with less rain in Southern California, we can expect more brush and forest fires. More worrisome is that pine trees may disappear from parts of the Sierra. They play a crucial role in retaining water for the spring run-off, which fills rivers, lakes, reservoirs and comes through your tap. "Well it's the trees on land that soak up water and feed reservoirs. Some of these shifts are reducing trees on the land. They're dying out," Gonzales said. According to scientists, change is normal and constant, but change this fast is more than a little frightening.
Gonzales, et. al., Global patterns in the vulnerability of ecosystems to vegetation shifts due to climate change, Global Ecology and Biogeography, June 2010.
June 5, 2010 The Dead Trees in Yellowstone are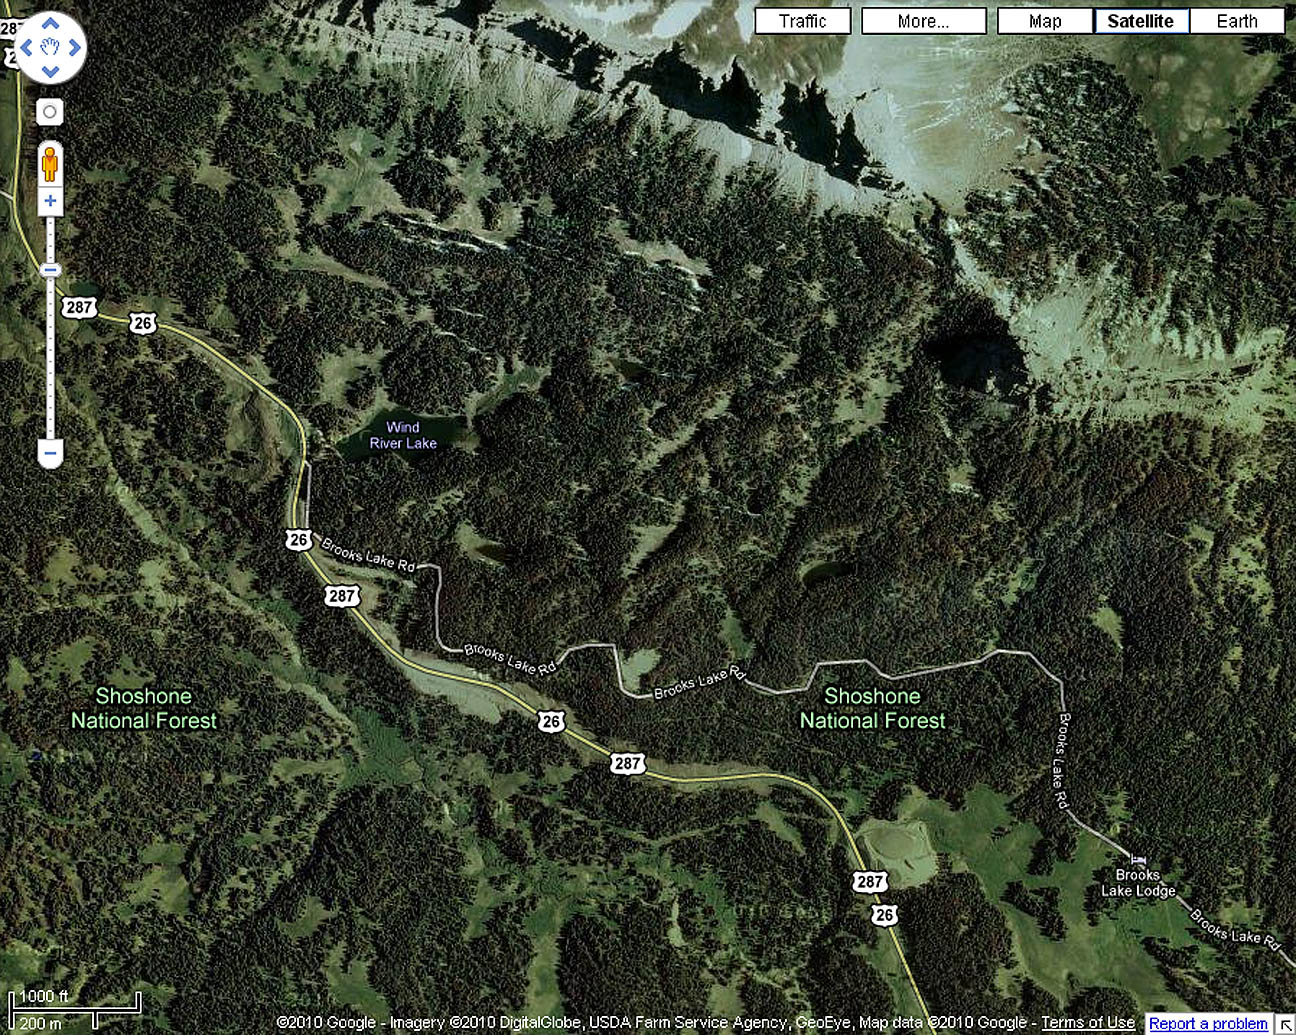
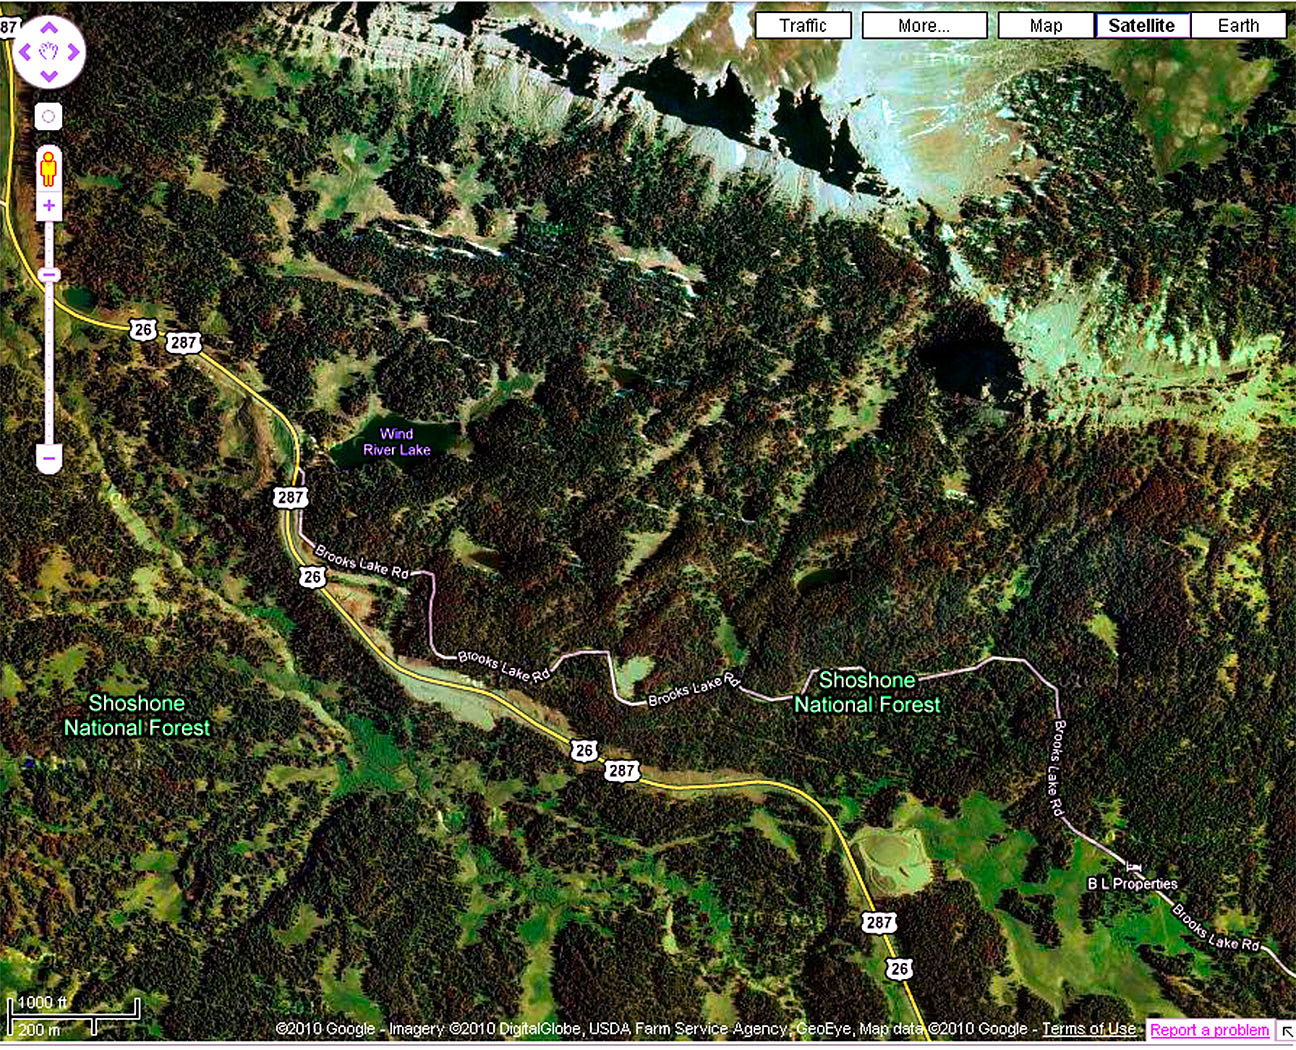 Visible
on Google I was chasing down the location of one of my
favorite webcams today - Brooks Lake Lodge in the Shoshone National Forest
just east of Grand Teton National Park and immediately south of Yellowstone
National Park. I was curious as to the elevation of the lodge, they had a
good snow year there this year and there is still more than a foot on the
ground. So I Googled up Brooks Lake Lodge on Google satellite image, to my
astonishment, there was the red kill from the pine bark beetle pandemic
visible on Google!. The dead trees can be seen from space...
Visible
on Google I was chasing down the location of one of my
favorite webcams today - Brooks Lake Lodge in the Shoshone National Forest
just east of Grand Teton National Park and immediately south of Yellowstone
National Park. I was curious as to the elevation of the lodge, they had a
good snow year there this year and there is still more than a foot on the
ground. So I Googled up Brooks Lake Lodge on Google satellite image, to my
astonishment, there was the red kill from the pine bark beetle pandemic
visible on Google!. The dead trees can be seen from space...
I often update this page on my laptop, and when I pulled the Brooks Lake satellite image up on Google on the laptop the colors were not quite as vivid (I have a high end monitor on my video production work station in my office). So I have enhanced the goggle image to make the red kill more obvious. These images are from last summer because there is still snow on the ground at Brooks lake. I also checked the park road in Grand Teton just south of Jenny Lake where I did a lot of photography for the film. The red kill is obvious there too.
June 3, 2010 This Year - 2010 - Already has Surpassed 1998 and 2005 for the Highest Average Global Temperature of the Instrument Record http://data.giss.nasa.gov/gistemp/paper/gistemp2010_draft0601.pdf
June 3, 2010 Transportation Responsible for
More Warming Than Coal! Aviation Cools the Planet!
Transportation
(On-road in the chart) produces more warming than coal, and in fact, all power
generation combined. A study from Columbia University in the Proceedings of
the National Academy of Science has been the first to look at the big
picture. Burning fossil fuels, or clearing forest, landfills or agriculture -
all create both positive and negative forcings. The greenhouse gasses
that warm the planet are considered positive forcing,
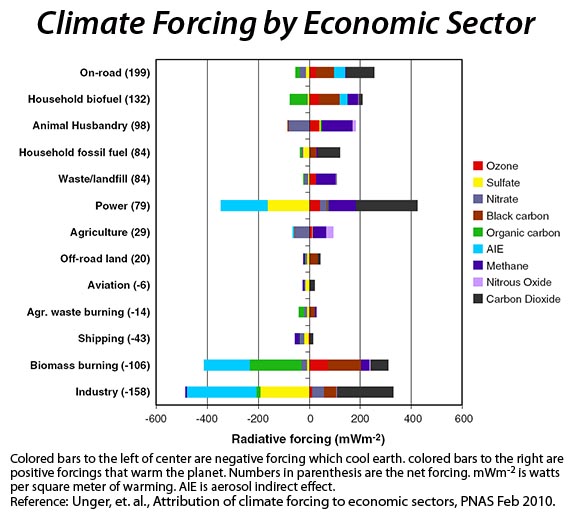 the
aerosols emitted are considered a negative forcing and cool the planet. Up
until now, nobody has done the math. Until now that is. A team led
by Nadine Unger at the NASA Goddard Institute for Space Studies has done
just that, and the amazing thing that they have discovered is that in the
short term, transportation creates more warming than power generation, and
in fact, more warming than any other economic sector.
the
aerosols emitted are considered a negative forcing and cool the planet. Up
until now, nobody has done the math. Until now that is. A team led
by Nadine Unger at the NASA Goddard Institute for Space Studies has done
just that, and the amazing thing that they have discovered is that in the
short term, transportation creates more warming than power generation, and
in fact, more warming than any other economic sector.
It is also the short term that is so important to climate change (which is short in the words of the author - not so short in real life... I explain further below) The feedbacks are critical to the short term. We must control our climate before the feedbacks take over. But how can transportation be responsible for more warming than power generation?
It all has to do with aerosols (sulfates are one form of aerosol). Aerosols are another emission that is associated with burning fuels. These aerosols cool the atmosphere and are sometimes known as bright soot because they reflect the suns energy back into space before it can strike the earth and warm things up. In the power generation industry, coal creates an immense amount of aerosols, but the transportation industry emits very few aerosols. So the net warming, as shown in the chart to the right, is much greater for the transportation sector than sectors that generate aerosols.
The study was based on constant emissions at the same levees that were emitted in 2000. The short term was modeled at the year 2020 and the long term at 2100.
In 2100 however, Power Generation has caught up and surpassed transportation. This is because of the long-lived lifetime of CO2, methane and nitrous oxide. Because of their long lives, they continue to build in the atmosphere. The aerosols only last for a few to several years. But it takes Power Generation decades and even generations to catch up. By 2100 the study shows that Power is responsible for only 33% more warming than transportation. Transpiration is responsible for 152% more warming than power generation in the short term of the next 50 or 70 years.
Now for the uber crazy part - those airlines that are so damming for global warming? The net effect of the their total emissions in the short term is a negative forcing - they cool the planet... In the long term the total warming is only about 1% of the total warming from all anthropogenic sources.
I don't make this stuff up folks... So, what does this mean? It means that we are simply barking up the wrong tree. We should be placing emphasis, by far, on the transportation sector, because remember, it's the feedback effects that are the most important. Once they get rolling in earnest, they will likely be unstoppable and we will be committed to degrees more warming at the minimum. This is on top of the warming already projected.
Unger, et.a l., Attribution of climate forcing to economic sectors, PNAS Feb 2010.
June 2, 2010 Copenhagen Will Lead to Emission Increases by 2020 of 10% to 20% Greater Than Todya's Levels
The devastating effects of a voluntary regime like the Copenhagen Accord have been highlighted in a recent article in the scientific journal, Nature, written by Joeri Rogelj, Malte Meinshausen and other scientists from Potsdam Institute in Germany. Entitled “Copenhagen Accord pledges are paltry,” the article concludes that the present emission-reduction pledges made under the accord will lead to a world with global emissions of 47.9 gigatonnes to 53.6 gigatonnes of carbon dioxide equivalents (GtCO2-eq) per year by 2020. This is 10% to 20% higher than today’s levels. And if nations proceed on the basis of the few pledges they have made for 2050, the Copenhagen Accord will almost certainly miss its own 2 degrees centigrade goal (to limit the mean global temperature increase to 2 degrees higher than pre-industrial levels). The scientists estimate there is more than a 50% chance the warming will exceed 3 degrees by 2100.
May 31, 2010 Oceans Can Change, Forests Can't This landmark study by the French National Center for Scientific Research, reveals the results of The Continuous Plankton Recorder Program that has been monitoring plankton species and abundance at Plymouth in the United Kingdom, every month since1946. They have been studying nearly 450 species of plankton in the North Atlantic and have found that a great mass migration has occurred in about the last ten years. It also appears that the rising ocean temperatures is responsible for a 25% to 33% reduction in the size of the single and few celled animals called "primary productivity". These algae and tiny crustaceans are the forests of the oceans. They are what is responsible for everything else in the ocean. They are where the ocean ecosystem begins, just like the trees of the forest and they make about half of the oxygen on the planet too.
What does this mean for the ocean and the great carbon sink and oxygen on earth? The scientists can't say yet, this is a relatively new discovery and years of additional data will be required for the statistics to be proven. But the obvious answer will likely be revealed. When you reduce the size of the individuals that make a population, but their numbers remain the same, carbon sequestration will be less. Probably about 25% to 33% less, And the oxygen production?
This press release says that 84% of climate change occurs in the oceans. They do not explain what they mean by this, but some of the stats I have seen in other places show that only about 15% of the warming from greenhouse gases goes into raising the temperature of the planet. The rest goes into the great ocean heat sink and forestalls atmospheric warming, literally by two to three decades. This of course means that atmospheric warming today is directly relative to atmospheric greenhouse gas concentrations from two to three decades ago and it will take another two to three decades for the true warming, that is being caused by greenhouse gas concentrations today, to actually be revealed.
Primary productivity in the oceans can change if it warms. Ocean currents allow the "trees" of the ocean forest, the primary productivity organisms, to change as fast as the currents change the water which can be 4 mph or more. Forests on land however cannot change in such a rapid manner. When the ecological conditions that allow a forest to grow change, the trees die. What replaces them does so on a decadal or generational time frame, not at 4 mph. The dead forest will remain dead, or it may grow back, smaller and different trees may grow. But it will take 100 years.
The pine bark beetle pandemic in the North American Rockies is over 20 times larger than the last largest pine beetle infestation known to have ever occurred. The size of this newest pandemic is increasing and forest professions see no reason that it will not continue to increase in size into the foreseeable future.
Press Release French National Center for Scientific Research
May 28, 2010 Technological Utopianism - the Momentum of Ignorance A paper by a University of Alberta researcher "System Failure: Oil, Futurity, and the Anticipation of Disaster," published in the South Atlantic Quarterly, finds that most people have a dream, unsupported by fact, that we can, because of our advanced technology, outsmart anything. The paper finds that there are many things blocking non-climate specialists understanding of climate science and the impacts of climate change. What I mean is, or what the author meant is that we fool ourselves, we lie to ourselves and we are arrogantly over-confident. What we have come to understand with other sciences, that with knowledge comes behavioral change, is not necessarily so with climate. The author says "there are three social narratives that prevent people from acting on the knowledge they have concerning the effects of oil on the environment: strategic realism, the notion that oil production is good because it supports economic security; eco-apocalypse, which the author explains as our incapacity to act on knowledge we have; and technological utopianism, the belief that technology will solve environmental problems resulting from oil and its usage." Technological Utopianism. While this may be a great name for a band, it sure is making it tough to get the truth about the climate crisis understood. While the citizenry is out there thinking that global warming will probably end up being a good thing, and if it's not, we can fix it like we fixed the ozone hole. (By the way, We set an all time record large ozone holes in 2006, in case you have bought in to that one too. - see here. The ozone hole in 2009 was 22 million square kilometers, only 18% smaller than its largest ever size. Yeah, the Montreal Protocol worked. It kept us from losing the zone layer complete and frying like an earthworm on the surface of Venus. The size of the ozone hole in 1978 was only slightly larger than zero million square kilometers...)
Szeman, System Failure: Oil, Futurity, and the Anticipation of Disaster, South Atlantic Quarterly, May 2009.
May 25, 2010 Mt. Everest Trail Melting From the Telegraph: "Rising temperatures have melted much of the ice on the steep trail to the summit and climbers are struggling to get traction on the exposed rock surface, according to the 49-year-old Sherpa, known only as Apa. The melting ice has also exposed deep crevasses which climbers could fall into, and experts have warned that people scaling the mountain risk being swept away by “outburst floods” from rising volumes of glacial meltwater. Apa, who grew up in the foothills to Mount Everest, reached the 29,035-foot (8,850-metre) summit on Saturday for the 20th time, breaking his own previous world record for 19 ascents. After returning to Kathmandu on Tuesday, he said: "The rising temperature on the mountains has melted much ice and snow on the trail to the summit. It is difficult for climbers to use their crampons on the rocky surfaces.” He said there was hardly any exposed rock on the trail to the summit when he first climbed Everest in 1989, but now the slopes are dotted with bare rocks. The world’s highest mountain is becoming an increasingly popular tourist destination, with a procession of novice climbers scaling the summit with the help of highly expert Sherpas like Apa."
Global Warming is Making Mt. Everest More Dangerous to Climb
May 24, 2010 April was the Hottest April Ev er
Recorded The period January through April 2010 was
the hottest January through April ever recorded. The average ocean
surface temperature for April was the warmest ever recorded. Arctic sea ice
was below normal for the 11th consecutive April. Snow coverage in the
Northern Hemisphere was below average for the seventh April in a row. The
amount below normal (snow coverage) was the largest ever recorded in April.
er
Recorded The period January through April 2010 was
the hottest January through April ever recorded. The average ocean
surface temperature for April was the warmest ever recorded. Arctic sea ice
was below normal for the 11th consecutive April. Snow coverage in the
Northern Hemisphere was below average for the seventh April in a row. The
amount below normal (snow coverage) was the largest ever recorded in April.
May 21, 2010 Greenland Melt Acceleration Can Be Seen in the Increasing Uplift of the Land Beneath Greenland “It’s been known for several years that climate change is contributing to the melting of Greenland’s ice sheet,” Dixon says. “What’s surprising, and a bit worrisome, is that the ice is melting so fast that we can actually see the land uplift in response,” he says. “Even more surprising, the rise seems to be accelerating, implying that melting is accelerating.” Tim Dixon is on of the Authors of this recently published paper in Nature Geosciences. The scientists are using high precision GPS data to see the rise in the rock around the margins of the Greenland Ice Sheet. As the ice melts, the land rises. This means that there is a lot of ice melting awfully quickly. The movement is large enough to be distinguishable from the rebound happening after the much larger Northern Hemisphere ice sheets melted (disintegrated) after the last ice age ended 10,000 to 17,000 years ago. The scientists are looking at the acceleration of the ongoing rebound. The ground is rising faster, and the speed that it is rising is increasing. This is just another example of a feedback. Ice melts in Greenland, contributing to sea level rise. The melt has beome large enough to allow the land rebound beneath the ice to accelerate. This displaces more water and sea level rise is actual more than the amount of melt.
Press Release - Rosensteil School of Marine and Atmospheric Science
May 21, 2010 The Upper 700 Meters of Ocean has Warmed More Than the Heat Generated by 2 Billion Atomic Bombs Similar to the Hiroshima Bomb
From Science News: "Earth’s upper ocean warmed substantially between 1993 and 2008, a new analysis reveals. The trend signals growing heat storage in oceans, researchers say, a result of human-caused warming. The new study, reported in the May 20 Nature, combined oceanographic data gathered worldwide between 1993 and 2008, the time period with the most data available. During that period, the upper 700 meters of the world’s ocean warmed on average by about 0.18 degrees Celsius, says John M. Lyman, a physical oceanographer with the National Oceanographic and Atmospheric Administration in Seattle. “But that little bit of temperature increase represents a lot of heat,” Lyman says. In fact, Lyman and his colleagues estimate that the total heat added to the oceans during that 15-year period is equivalent to the energy that would be released by exploding about 2 billion Hiroshima-scale atomic bombs, he says. Most of that added heat comes from the greenhouse effect, which in turn stems from the heat-trapping effect of gases like carbon dioxide, Lyman says. Because water has a vastly higher capacity to absorb heat than air, between 80 and 90 percent of the heat trapped by the greenhouse effect eventually ends up in the ocean. "
http://www.sciencenews.org/view/generic/id/59362/title/Oceans_warmed_in_recent_decades
May 20, 2010 European Science Foundation - Oceans are already 30% More Acidic Than They Were 200 Years Ago. "Ocean acidification is more rapid than any time in the last 35 million years." The Oceans are our largest natural sink for CO2. They absorb excess carbon dioxide from our atmosphere, but the oceans become more polluted as they absorb more CO2. It's like a bioaccumulating toxin. CO2 is the mercury of our ocean's water. The CO2 pollutes our oceans just like it pollutes our skies. Ocean acidity is rising and has already begun to rise beyond evolutionary constraints in some areas. Some ocean organisms can no longer be found where they have always been found because the ocean has become too acidic for them to survive. In a hundred years the oceans are expected to be 0.4 pH points lower than today. This is an astonishing 2 1/2 times more acidic than today. And this would be the good news. The European Science Foundations says that the literature shows an ocean tipping point at around 0.2 pH units more acidic than today. This level could be reached in 30 years. What does this mean? First, the oceans would absorb a tremendous amount LESS CO2 (the more acidic the oceans become the less they CO2 they can absorb). This is one of the big positive feedbacks that scientists worry about that is NOT included in the models. Second, there would likely be a mass extinction on the order of what happened in our oceans 55 million years ago when a lot of methane hydrates melted and cause significant global warming. Third, primary productivity in the oceans would crash. Primary productivity is the plankton and algae and such - the masses of single celled and few celled plants species that create oxygen. They are responsible for about half of the oxygen on our planet. If they go extinct we have a new problem.
May 19, 2010 "Climate is Changing Ten Times Faster Than Predicted" Dr. Konrad Steffan, Director of CIRES - the Cooperative Institute for Research in Environmental Sciences at the University of Colorado Boulder *** I talked with one of the scientists that I interviewed in Greenland in 2007 recently. I had found a previously forgotten quote that appeared to be from him in my notes from my trip and I wanted to confirm. The quote was "Climate change is proceeding ten times faster that we had predicted". This scientists is Dr. Konrad Steffen, Director of the Cooperative Institute for Research in Environmental Sciences at the University of Colorado Boulder. When he returned my email he was sitting in the same hotel that I had interviewed him. He had just completed a month-long field session at Camp Swiss on the ice sheet. Dr. Steffen founded Camp Swiss in 1990. His email confirmed that he remembered me and our interview, and that indeed, climate change was progressing ten times faster than predicted... How much faster is ten times faster? It is as if one's average 81.5 year-long life was condensed down to 8 years and 6 months...***
Cooperative Institute for Research in
Environmental Sciences at the University of Colorado Boulder/a>
May 15, 2010 Burning Buried Sunshine
196,000 pounds of plants are required to produce a gallon of
gasoline. It takes 40 acres of plants, roots, stalks and leaves, to go 20
miles in the average car. I ran across this paper in my archives from 2003
and the information is oh-so timely. It is just incredible how much buried
sunshine, how many fossilized photons it takes to make up a little bit of
oil. Jeff Dukes, published this paper in the journal Climatic Change.
This is how much ancient plant matter had to be buried millions of years ago
to produce one gallon of gas. Dukes calculated that the total amount of
plants burned in 1997 was 97 million billion pounds of carbon, which is
equivalent to more than 400 times all the plant matter that grows in the
world in a year. The amount of plants that went into the fossil fuels
we burned since the Industrial Revolution began (in 1750s) is equal to all
the plants grown on Earth over 13,300 years. This ancient solar energy is
normally emitted back into the environment over millions of years. We are
literally releasing this carbon millions of times faster than it is
naturally.
Dukes, Burning buried sunshine, Climatic change, 2003.
http://abcnews.go.com/Technology/story?id=99635&page=1
May 13, 2010 Fabulous 114 Year Local Record of
Climate Change from Upstate New York and Classically Bad Contrarian Science
by Anthony Watts A wonderful weather record collected at a
private resort 90 miles north of New York City over 114 years has surfaced
in an article in the Journal of Applied Meteorology. The record is missing
only 37 days. It has been handed down from generation to generation at a
wilderness resort at a place called
The Mohonk Preserve. These
folks have also kept track of plants and animals and things - the first
bloomers and so forth.
Traditional climate science says that climate change is a big thing -
holistic, and generally not visible on a regional basis. Or at least beyond
polar regions, regional observations are not reliable indicators of climate change.
This concept however is just no loner valid.
The scientists say that Climate change has emerged from the noise. What this
means is that - we can see it now, it is everywhere. It is no longer masked
by the noise statistical noise of weather chaos. So in your area, your
region, that warming that has been going on for a decade now - it is climate
change. It is real, it is happening now and it is happening to you.
The persistent cry that the climate guys and girls cannot
really tell whether or not any individual weather event has been caused by
climate change or not is also now defunct. Our climate has changed now. It is different
than it has been for centuries, and mankind has caused the changes. It has
changed all over the globe, less at the equator and more at the poles.
Today, ALL weather has been caused by climate
change.
Oh, but I digress. The Mohonk Resort is an example of a weather station that
has stayed the same for over a century. There is no urban heat island effect
that has grownup around this place. It has not moved several times as the
City around it changed, the airport moved, the weather service office moved,
etc. It is the perfect example of a true record of climate change. And the
temperature has increased by 2.63 degrees. Temperatures are up in all
seasons but the increase is more evident in the extremeness and frequency of
summer heat waves. Today's temps top 89 nearly 20 times per year whereas before 1980 it
was rare to top 89 ten times per year. Freezing days are decreasing by one
day every five years and since 1970
about one day every two years.
The one statistic that has not much changed is the beginning of spring, which may
seem peculiar until you understand the rest of the story. Late winter
season warm spells, or false springs have recently been happening much more
often. These warm spells fool the local
plants into thinking it is spring. The plants and trees bud out and winter
returns and freezes the new growth off setting the real spring back by
weeks. False springs are not a new thing, but the arte that they are
happening these days is.
Now for the "bad science" part. Anthony Watts, has posted on his blog (here)
a classic piece about the problems that this weather monitoring station
exhibits and because of these problems the data is now invalid. The
station is not high enough off of the ground, it is in the forest, it is too
close to a building, and the list goes on. One certainly can not argue
with the specific charges made by Watts. The weather station is clearly
set up without regard to quite a few weather station citing criteria.
But the point is entirely missed. So the data is skewed one way or another;
biased because of poor citing. The station is in a forest, next to a
building, etc. Valid criticisms, but what
is the result? A skewed record of warming? The authors of this piece, on
"bad climate science", are out too discredit any and all climate science.
The see a little problem and the whole lot is discredited. They are not analyzing the information
given them to see if anything useful may exist. Their mission is only to tear
down. The bathwater is dirty so let's throw out the baby too.
What was not asked in Watts' article, of useful nature rather than destructive
nature, was: How long has that building been there? How long has that
chimney been there? How long has that forest been there? What is the long
term bias of a weather station in a forest? Is the bias introducing errors
into the trend? Is the trend no longer valid because of the bias(es)? Do the
biases change the magnitude of the trend? Are the biases even noteworthy
because the trend is the important thing to be understanding anyway?
The
mission of individuals like Anthony Watts is to discredit climate science.
Any error to them gives air to the cry of invalidity. It does not
matter if the errors have no bearing on the question asked, it does not
matter if the errors can be mitigated for accurately in complete approval of
the science in question. It does not matter that the errors do not affect
the end analysis because the end analysis is not dependent upon the
conditions that induced the bias... Their mission is simply to discredit
minutia and therefore the whole concept is discredited. (The baby and the
bath water thing.) That is not useful nor productive, and it is just plain
old bad science.
The useful thing here is the trend. It is independent from any bias
that may exist. Gosh, with
such a long trend, there would have to be major discrepancies in the way the
data was collected to produce a bias that affected the trend. The
publishing of this data and the results in the Journal of Applied
Meteorology should be enough for us to understand the data is valid from a
statistical standpoint. So the trend is valid. Maybe it's skewed a bit
here and there, likely in opposite directions (that's how chaos works...),
but we will never know. We do not have enough data to show how each
individual tree's loss of individual limbs affected site temperatures.
But
added together, over such a long period, where the baseline conditions
changed little, where the buildings have been there for 114 years and the
weather station has been located in the same place in the same forest for
114 years - what are the chances that the trend was affected?
Who cares if
the baseline is impacted - We are not concerned with the baseline. We are
concerned with the trend. Bad science is easy to recognize. The language is
negative, not neutral.
On top of that, observers have for decades recorded related phenomena such
as first appearances of spring peepers, migratory birds and blooming plants.
At a time when scientists are wrestling to ensure that temperature readings
from thousands of divergent weather stations can be accurately compared with
one another to form a large-scale picture, Mohonk offers a powerful
confirmation of warming climate, as well as a compelling multigenerational
story.
Oh and by the way, those clever guys and girls in climate science and
meteorology have both learned to adjust :"biased" weather data so that it
may be used in climate analysis. So this tremendously cool weather record is
still valid, and it still being used by the National Climactic Data Center
in the analysis of climate.
May 10, 2010
Limits to Mammalian
(Including Humans) Adaptability on a Warmer Planet A
paper in the Proceedings of the National Academy of Science looks at the
physiological adaptability of mammals to warming. It finds that even though
temperatures have briefly been to 10 degrees C above the present, temps
above 7 degrees C warmer than today would begin to see areas across the
planet become
uninhabitable to mammals because of heat stress. This must not be confused with the
middle of the Sahara Desert being uninhabitable heat stress. That area is
habitable. The habitability is poor, but it is inhabitable. What the authors are describing is the
point when heat dissipation by the body at night can not overcome the heat
gain in the daytime. Nighttime temperatures become too warm and a continuous
heat stress sets in that results in death. This is as much a function
of humidity as it is temperature. Most of us have likely heard of the great
heat wave in Europe in 2003 where 37,000 people died. This heat wave
occurred in places where they do not normally have air
conditioning and nighttime heat was so great that old folks who were weak or
stressed for some other reason, could not cool off enough, even in front of
a fan, at night, to relieve the heat stress of the day. These people
died because they could not cool down enough. What the authors are talking
about are conditions where all humans, and virtually all mammals would
succumb to these overheated conditions, not just old folks.
Today's emissions are tracking along, or worse than, the worst-case IPCC
scenario. the temperature increase at the end of the 21st century, following
along with these emissions that are tracking along the worst case scenario,
reach approximately 6.4 degrees C. warmer than today (the 1980 to
1999 average). This is an average global temperature increase of 11.5
degrees F. It is a couple of degrees less than the difference between the
deepest cold of the ice ages and the interglacial warmth between the ice
ages. These temperatures will make areas of the planet uninhabitable.
mammals, including humans if they have to stay outdoors, in unairconditioned
conditions for long periods or time. Humans could survive in air conditioning, but
interruption of the air
conditioning would be deadly.
For the next
several hundred years though, temperature will continue to increase. The
authors warn that at some point in the next century or two, our entire
planet could, if we don't act soon, become completely uninhabitable.
Sherwood et. al., An adaptability to climate change due to heat stress,
PNAS, May 2010.
May 09, 2010 Greenland Glacier Discharge
Increases 220% in Summertime
Ian Bartholomew
at Edinburgh University in Scotland said the variability was much stronger
than earlier observations of glacier movement in Greenland. The study was
published in the journal Nature Geoscience. this behavior was not observed
before about the mid 1990s. It was also tat about this time that great
icequakes were discovered coming from the Greenland ice sheet.
A paper published in 2007 describes a new icequake that has been found
mostly in Greenland. These icequakes are much larger than their traditional
icequake brothers, coming in at magnitudes between 4.6 and 5.1 on the
Richter scale. They are unlike traditional icequakes in that their magnitude
is much large and their times scales are between 35 and 150 seconds.
Traditional icequakes have a magnitude of no greater than 2.7 and last only
one second or less. These icequakes were discovered in a summary of global
seismic data and pinpointed to outlet glaciers in Greenland in 2003. The
recent report describes “a dramatic increase in the number of these
icequakes since 2002”, and a doubling of their numbers in 2005 above any
single year prior to 2003.
These icequakes are probably caused by meltwater draining down to the bottom
of the ice sheet through cracks. The ice basically lubricates the ice and
lets it flow more quickly. Satellite observations have shown the ice
actually rising – floating on this film of water, up to two feet during the
highest melt periods. This allows the ice to unstick from the bedrock and
slip frictionlessly downhill. When the ice grinds to a halt against the
bedrock it creates the icequakes.
Khan, et. al., Spread of ice mass loss into northwest Greenland observed,
Goephysical Research Letters March, 2010.
May 07, 2010 Nitrous Oxide 310 Times More
Potent Than CO2, Permafrost Emissions Increase 20-Fold Upon Melting Over
millennia, cold, wet conditions have slowed the breakdown of plant material
in the Arctic, and large quantities of carbon and nitrogen have built up in
permanently frozen ground — termed permafrost. The depths of permafrost can
be astonishing - up to six and seven thousand feet. much of the Arctic is
underlain by between 500 and a thousand feet of permafrost. Climate change
threatens to thaw these frozen soils and release large quantities of methane
and carbon dioxide to the atmosphere. Nitrous oxide — another potent
greenhouse gas — can also be emitted from permafrost soils. It was
originally through that nitrous oxide did not play a large part in
greenhouse gas emissions from thawing permafrost -and it does not - at least
upon the initial thawing. But a complex set of biogeochemical circumstances
release a tremendous amount of nitrous oxide when the thawed permafrost is
rewetted and allowed to decompose in an oxygen deprived environment: Like
under water. These circumstances happen a lot more often that one
might think. In fact, they happen as a rule rather than not. Thawing
permafrost tends to create what are called thermokarst lakes - or thawed
permafrost lakes. The organic matter in the permafrost, which has been
from stored in the deep freeze for millennia to hundreds of millennia, can and readily does decompose
underwater - in an oxygen deprived environment. Methane (35 times more
potent that CO2, not 21 to 25 times more potent like we once understood) is the primary decomposition product, but nitrogen oxide
production is twenty times greater than was initially understood. This
change in magnitude is something that the authors say should be taken into
consideration in climate modeling, because it can make a difference.
April 10, 2010 Arctic Sea Ice Chaos, a Warmer
than Normal Canadian Winter, Climate Contrarian Propaganda and the Media Gets
It Wrong Again: Here is a hint that will help you to
recognize climate contrarian propaganda. If a reporter, or a
"scientist" for that matter, talks about the Arctic Ice Cap
- feel free to ignore them - there is no such thing. You can be assured that
what follows "Arctic Ice Cap" will be as much fiction as is an Arctic Ice
Cap. An ice cap is a small ice sheet. Ice sheets are grounded on land,
either above or below the ocean. An ice sheet is what
covers Antarctica and Greenland.
There are ice
caps in Alaska, the Himalayas and the Andes
.Sea ice is what covers the Arctic Ocean and
the north pole, and in the winter, sea ice around Antarctica nearly doubles
the area at the bottom of the world that is covered in ice. Sea ice is no
thicker than about ten feet, unless the tides and ocean currents have been
smashing it together into giant pressure ridges.
An unknown (to me) media source out there has put out a story about the
Arctic Ice Cap and of course all of the other media kids have copied it and
now everyone is using the Arctic Ice Cap phenomena incorrectly. The
misinformation of course is magnified by the media's good intentions of
portraying two sides to every story, only one side of this story is fiction.
the different articles are variously spreading the word that ranges from
climate change is bunk because the ice cap has recovered to normal, or
adding more doubt to the climate change doubters chest of hope by quoting a
recent paper that says that Arctic "winds" were responsible for 30% of the
sea ice loss in the record 2007 year.
Arctic sea ice has
gone from a record low in late January to near average this month - pretty
crazy,
"Northern sea ice is nearly back to average levels globally for the
first time in at least a decade after years of spectacular declines. The
surprise growth at a time of year when ice is normally melting has triggered
a blizzard of I-told-you-sos among online climate change skeptics. But the
man whose data is behind the furor says a few weeks of cold weather in one
part of the Arctic - not an end to global warming - has skewed the numbers.
Mark Serreze of the U.S-based National Snow and Ice Data Center says ice in
most northern waters, including Canada's eastern regions, is still well
below average. He says skeptics should be careful to distinguish between
weather - which is local and short-term - and climate, which covers broad
stretches of time and space."
Back to the propaganda and the media's good intentions. The
study that finds that Arctic winds are responsible for 30% of the record
2007 Arctic sea ice loss? Not so fast. I am familiar with the
paper, and actually there have been several since 2007 that show that
changed wind fields are responsible for ice being blown out the Fram
Straights east of Greenland, this is not new. What is new is the media
highlight. What is also not new is the projections of the U.S. Naval sea ice
researchers that projected that the Arctic will be ice free in the summer as
early as 2013 to 2020. The first projection of this condition was made in
2003. This is of course four years before the record 2007 minimum ice
extents took place. The reporting of the new study about the winds however
is given credence as 'casting doubt" on other scientists cautioning
statements about Arctic sea ice is decreasing more rapidly than projected.
Arctic sea ice is indeed decreasing in aerial coverage more rapidly than
predicted. It is doing so some 40 to 70 years more rapidly than predicted.
Temperatures in the Arctic have changed all over by 3 to 4 degrees, 6 to 7
degrees in many places and in northern Siberia, the temperature has warmed
up to 9 degrees, all in the last 20 or 30 years. This warmth has
either changed polar wind fields or in some cases has been caused, or
increased by changed polar wind fields. They are all inter-related and all
are a result of climate change. So any reporting that the winds are to blame
and not climate change is like saying that Jack the Rippers knife was the
one responsible for all the murders, not good ol' Jack.
National Snow and Ice Data Center
March 29, 2010 Ten Things You
Should Know About the Climate Crisis:
It's climate science pandering like this that has gotten us into this mess
to start with. Here's what the US News list should have looked like:
1) The IPCC 2001 report said that Antarctica would not start losing ice for
100 years. Since then, Antarctica has not only started losing ice, but is
now losing as much as Greenland. Greenland’s ice loss has doubled since
2000.
2) The rate that sea level is accelerating is 30 times faster than it was
for most of the 20th century.
3) At the rate that sea level is rising today, it will cross the coastal
barrier island disintegration threshold in 3 to 4 years.
4) A climate change induced beetle infestation in the Rocky Mountains has
killed 52 million acres of trees since about the turn of the 21st century.
The last record breaking beetle infestation of this sort was 3 million acres
in ten years.
5) Arctic sea ice is melting 40 to 70 years ahead of schedule.
6) The Arctic Ocean has not been ice free in summer in 14 million years.
7) The Laptev and northern Siberian seas are now releasing as much methane
from melting methane ice, frozen into permafrost during the last ice age
when sea level was 250 feet lower, as all of the world’s oceans combined.
Methane is a greenhouse gas that was recently discovered to be 34 times more
potent than CO2 - we have understood for decades that it was 24 or 25 times
more potent.
8) The undersides of the great ice sheet discharge rivers emptying the
Greenland Ice Sheet are now melting 100 times faster than the surface
because of changed, warmer ocean currents.
9) The Arctic winter is one month shorter than it was thirty years ago.
10) A warmer planet will produce more snow for many decades before it gets
warm enough to create less snow. The reason is because warmer air holds more
moisture.
11) A warmer planet will produce more icebergs because melt water penetrates
crevasses to bedrock, lubricating the ice rivers. Warming ocean currents
beneath ice shelves and ice rivers destabilize the ice and cause it to
disintegrate faster. The massive ice shelves break apart into massive
icebergs.
12) Because of a warming climate, one quarter of all of the species that
Thoreau found at Walden Pond have become locally extinct and one third of
the total are at risk of becoming locally extinct.
13) Our oceans today are acidifying ten times faster than at any time in the
last 65 million years.
14) During the interglacial warm period before this one, the closest time in
the history of our planet that we can compare to now, sea level rose 6 to 10
feet in 24 years, likely when the West Antarctic Ice Sheet collapsed.
15) We have understood for decades that CO2 lasts for 100 to 200 years in
our atmosphere and as our planet warms, CO2 will last even longer. Today,
given the warming that our planet has undergone already, half of CO2
emissions now stay in our atmosphere for 300 years. Half of what remains
stays there for 10,000 years and the remainder stays there forever. In the
future, as our planet continues to warm, CO2 will last even longer.
16) Carbon dioxide levels are rising faster than at any time in the last 65
million years – that is, any time since the giant asteroid hit the Yucatan
Peninsula and the dinosaurs went extinct.
March 28, 2010 Greenland Melt Accelerating
-
Abstract -
Greenland's main outlet glaciers have more than doubled
their contribution to global sea level rise over the last decade. Recent
work has shown that Greenland's mass loss is still increasing. Here we show
that the ice loss, which has been well-documented over southern portions of
Greenland, is now spreading up along the northwest coast, with this
acceleration likely starting in late 2005. We support this with two lines of
evidence. One is based on measurements from the Gravity Recovery and Climate
Experiment (GRACE) satellite gravity mission, launched in March 2002. The
other comes from continuous Global Positioning System (GPS) measurements
from three long-term sites on bedrock adjacent to the ice sheet. The GRACE
results provide a direct measure of mass loss averaged over scales of a few
hundred km. The GPS data are used to monitor crustal uplift caused by ice
mass loss close to the sites. The GRACE results can be used to predict
crustal uplift, which can be compared with the GPS data. In addition to
showing that the northwest ice sheet margin is now losing mass, the uplift
results from both the GPS measurements and the GRACE predictions show rapid
acceleration in southeast Greenland in late 2003, followed by a moderate
deceleration in 2006. Because that latter deceleration is weak, southeast
Greenland still appears to be losing ice mass at a much higher rate than it
was prior to fall 2003. In a more general sense, the analysis described here
demonstrates that GPS uplift measurements can be used in combination with
GRACE mass estimates to provide a better understanding of ongoing Greenland
mass loss; an analysis approach that will become increasingly useful as long
time spans of data accumulate from the 51 permanent GPS stations recently
deployed around the edge of the ice sheet as part of the Greenland GPS
Network (GNET).
Movie
http://www.agu.org/pubs/crossref/2010/2010GL042460.shtml
http://colorado.edu/news/r/f595fae00e6b451d4016ab9a43a049f8.html
March 21, 2010 NASA Says No Change in Rate of
Warming In their Current GISS Global Surface
Temperature Analysis, NASA finds that the there has been no reduction
in the global warming trend of 0.15-0.20°C/decade that began in the late
1970s. The cold winter we have just had was nothing to the extra warm
Arctic winter
NASA says that because public opinion about climate is affected by recent
weather and that the cool summer of 2009 contributed the increasing
skepticism about climate change in the U.S. (This is particularly ironic as
much of Texas had its warmest summer season ever recorded). NASA goes
on to say that 2009 was the second warmest year ever and 2005 was the
warmest year ever - both support the overall warming trend that NASA has
reaffirmed.
NASA also says that there are numerous natural cycles occurring right now
that makes the continues warming trend particularly extreme. The
largest sunspot minimum in a hundred years is one and the Arctic Oscillation
Indexes another. The Arctic Oscillation Index is a measurement of the
difference in intensity of polar vs. middle latitude weather systems.
When the AO is negative, we have cold weather in the northern Hemisphere,
the differences in the weather system intensities allows cold air to
penetrate further south.
What we saw this just passed winter in the AO was the most negative AO Index
that has occurred. But to not have the most extreme winter to have
ever occurred while this record AO Index was ongoing is an extreme example
of continued warming. The models have been telling us for decades now
that winters will warm more than summers, polar areas will warm more than
equatorial areas and nights will warm more than days.
Reference:
NASA Current GISS Temperature Record
March 20, 2010 Take CO2 Out of the Atmosphere
Now - and Reduce Emissions to an Extraordinary Degree: Or Else
A study by a team from Cornell says the IPCC is conservative.
Press Release, Cornell: World policymakers have underestimated climate
change impacts, says Cornell expert: Carbon must be scrubbed from
atmosphere. Charles H. Greene, Cornell professor of Earth and atmospheric
science, has published in the peer-reviewed journal Oceanography (March
2010). Greene is joined on the paper, “A Very Inconvenient Truth,” by his
colleagues D. James Baker of the William J. Clinton Foundation, and Daniel
H. Miller of The Road Group, Berkeley, Calif. The scientists conclude that
the United Nation's Intergovernmental Panel on Climate Change (IPCC) 2007
4th assessment report underestimates the potential dangerous impacts that
man-made climate change will have on society. The full paper is at:
http://www.tos.org/oceanography/issues/issue_archive/issue_pdfs/23_1/23-1_greene.pdf/a>
Greene says: “Even if all man-made greenhouse gas emissions were stopped
tomorrow and carbon-dioxide levels stabilized at today’s concentration, by
the end of this century the global average temperature would increase by
about 4.3 degrees Fahrenheit, or about 2.4 degrees centigrade above
pre-industrial levels, which is significantly above the level which
scientists and policy makers agree is a threshold for dangerous climate
change. “Of course, greenhouse gas emissions will not stop tomorrow, so the
actual temperature increase will likely be significantly larger, resulting
in potentially catastrophic impacts to society unless other steps are taken
to reduce the Earth’s temperature. “Furthermore, while the oceans have
slowed the amount of warming we would otherwise have seen for the level of
greenhouse gases in the atmosphere, the ocean's thermal inertia will also
slow the cooling we experience once we finally reduce our greenhouse gas
emissions. This means that the temperature rise we see this century will be
largely irreversible for the next thousand years. “Reducing greenhouse gas
emissions alone is unlikely to mitigate the risks of dangerous climate
change. Society should significantly expand research into geoengineering
solutions that remove and sequester greenhouse gases already in the
atmosphere. Geoengineering solutions must be in addition to, not replace,
dramatic emission reductions if society is to avoid the most dangerous
impacts from climate change.”
Press Release (here))
March 17, 2010 A Reply to Those Who Think That
Our Planet Has Stopped Warming The contrarian
propaganda says that global warming has ceased since about the turn of the
century, that our planet is no longer warming, so climate change theories
must be wrong. Arguments supporting this propaganda are misleading and
wrong. It may not appear so, but it is. What I have assembled below is
however, is not difficult at all to understand.
We have been setting global high temperature records regularly for most of
this century. The exception is the 50s, 60s and 70s. during this period,
particulate and sulfate pollution from rapid industrialization after WWII
caused a temporary slump in the regularity of new global high temperature
records. In 1970 the Clean Air Act put an end to the pollution and the
thermometer started to rise again. The following is the list of dates of
successive global high temperature records: 2005, 1998, 1997, 1990, 1988,
1981, 1944, 1938, 1931, 1926, and 1900 1897, 1889 and 1881. If
anything, the rate of record setting has sped up.
You can also tell these people "Man really did land on the moon, it was not
a hoax."
March 13, 2010 & Bark Beetle Update -
Millions of Acres More in 2009 Montana red kill up to 5
million acres from 3 in 2008.
http://www.fs.fed.us/r2/news/2010/jan/nr-foresthealth-pressconf-1-22-10.pdf
Half a million more acres of red kill in Colorado to bring the total to 3.6
million. Spruce beetle has infected an additional half million acres in
southern Colorado.
hhttp://www.dnr.wa.gov/Publications/rp_fh_2009_forest_health_highlights.pdfp class="style40">
Washington 1.36 million to 1.73 million total kill: 412,000 acres pine bark
beetle
Total Kill: 1 million acres of spruce beetle in the Yukon class="style40">
http://climateprogress.org/2009/08/20/bark-beetle-wildfire-climate-change/
http://www.csmonitor.com/Environment/Wildlife/2009/1210/butterflies-versus-beetles/a 77,500 trees, three times the normal amount, have been infested with bark
beetle in Sierra Chincua, Mexico at Mexico's Monarch Butterfly
Biosphere Reserve.
http://www.fs.fed.us/r2/news/2010/jan/nr-foresthealth-pressconf-1-22-10.pdf
March 11, 2010 More Ocean Dead Zones Create
Significant Greenhouse Gas Feedback
More and more
areas of the ocean are turning up with little oxygen. these anoxic, or "dead
zones" are caused natural but organic decay, they are caused by nutrient
pollution from stormwater runoff and they are caused by upwelling of deep
ocean waters that have naturally lost their oxygen load through a number of
different bio and geochemical
Just to name of few of the reasons that ocean currents change that are
caused by climate change; warmer waters tend to sink less than cooler
waters. Cooler water is denser and heavier and sinks. Global wind
fields are changing because of climate change, storm tracks are shifting
north, low pressure areas are becoming more intense, etc. Winds are one of
the major drivers of oceans currents. The changing currents, along
with the changing water temperatures (warmer water also holds less oxygen)
are creating more and bigger dead zones that are definitely not
associated with nutrient pollution (see here). Also happening, the warmer
waters are creating greater algae blooms more often.
So, obviously, dead zones are a big impact of climate change, one that will
only get larger as the planet continues to warm. But this new
discovery published in Science tells us that nitrous oxide (N2O) generated
in these dead zones may be a very troubling climate feedback. N2O is a
greenhouse gas 120 times more potent than CO2and has an atmospheric life of
300 years. it has been increasing at a similar rate to CO2 after being
stable for thousands of years before the industrial revolution. The current
understanding and use of N2O in climate models is that N2O is produced by
land use practices associated with agriculture and deforestation.
This study found that anoxic water found in dead zones create 10,000 times
more N2O than comparable waters that have normal levels of oxygen.
Codispoti, Interesting Times for Marine N2O, Science, March 2010.
March 10, 2010 China Consumes Far Less
CO2 Than We Understand Traditional methods of
determining CO2 emissions are based on energy production. The obvious
drawback to this method is that the producing country can export the goods
produced from the energy that causes the emissions. The exported goods are
then consumed, or used in other countries. This is the final
depository for "outsourced" manufacturing or other outsourced mechanisms.
It means that countries like the U.S. and the European Union, who are very
affluent relative to the rest of the world, can now consume even more
fossil fuels than they emit from their own energy generation. The
ratio is actually quite high. the U.S. is actually responsible for 10
percent more CO2 emissions than they create from the combustion of fossil
fuels, The European Union is responsible for 30% more CO2 emissions that
their fossil fuel burning reveals, and China is being blamed for 22% more
emissions than they actually consume because this 22% is exported to
the United States, European Union and the rest of the world.
Davis and Caldiera, Consumption-based accounting of CO2, PNAS, March 2010
March 3, 2010 Extreme Methane Fright
- Laptev Sea and East Siberian Arctic Shelf Methane Releases Rival
Those of All of Earth's Oceans Combined& Sometimes I
read these reports and feel that all is lost. But I also read the reports
about atmospheric sequestration and geoengineering. I get to see the
scientists' understanding of what may and what may not be feasible.
Then I read the economists' understanding of the world and climate change as
we know it. I put the two together and understand that, if we start spending
money on our environment like we are spending it on our institutions that
are too big to fail, we can tame the climate beast.
Maybe some day I will delve deeper and write more, but for now this page is
dedicated to reviewing the latest findings in climate science. The methane
time bomb may take the front running position in the climate crisis unless
the West Antarctic Ice Sheets gets on with its dynamical disintegrating act.
The situations is getting serious in the Siberian Arctic. We can only hope
that a catastrophic partial disintegration of the WAI comes first. If our
civilization gets the wake up call soon enough, we can disarm the methane
time bomb.
The following is reproduced from a University of Fairbanks Press Release
from their International Arctic Research Center:
A section of the Arctic Ocean seafloor
Release of even a fraction of the methane stored in the shelf could
trigger abrupt climate warming. "The amount of methane currently coming out
of the East Siberian Arctic Shelf is comparable to the amount coming out of
the entire world’s oceans," said Shakhova, a researcher at UAF's
International Arctic Research Center. "Subsea permafrost is losing its
ability to be an impermeable cap." Methane is a greenhouse gas more than 30
times more potent than carbon dioxide. It is released from previously frozen
soils in two ways. When the organic material--which contains carbon--stored
in permafrost thaws, it begins to decompose and, under oxygen-free
conditions, gradually release methane. Methane can also be stored in the
seabed as methane gas or methane hydrates and then released as subsea
permafrost thaws.
These releases can be larger and more abrupt than those that result from
decomposition. The East Siberian Arctic Shelf is a methane-rich area that
encompasses more than 2 million square kilometers of seafloor in the Arctic
Ocean. It is more than three times as large as the nearby Siberian wetlands,
which have been considered the primary Northern Hemisphere source of
atmospheric methane. Shakhova’s research results show that the East Siberian
Arctic Shelf is already a significant methane source: 7 teragrams yearly,
which is equal to the amount of methane emitted from the rest of the ocean.
A teragram is equal to about 1.1 million tons.
"Our concern is that the subsea permafrost has been showing signs of
destabilization already," she said. "If it further destabilizes, the methane
emissions may not be teragrams, it would be significantly larger." Shakhova
notes that Earth's geological record indicates that atmospheric methane
concentrations have varied between about .3 to .4 parts per million during
cold periods to .6 to .7 parts per million during warm periods.
Current average methane concentrations in the Arctic average about 1.85
parts per million, the highest in 400,000 years, she said. Concentrations
above the East Siberian Arctic Shelf are even higher. The East Siberian
Arctic Shelf is a relative frontier in methane studies. The shelf is
shallow, 50 meters or less in depth, which means it has been alternately
submerged or terrestrial, depending on sea levels throughout Earth’s
history. During Earth's coldest periods, it is a frozen arctic coastal
plain, and does not release methane. As the planet warms and sea levels
rise, it is inundated with seawater, which is 12-15 degrees warmer than the
average air temperature. "It was thought that seawater kept the East
Siberian Arctic Shelf permafrost frozen," Shakhova said. "Nobody considered
this huge area." Earlier studies in Siberia focused on methane escaping from
thawing terrestrial permafrost. Semiletov's work during the 1990s showed,
among other things, that the amount of methane being emitted from
terrestrial sources decreased at higher latitudes. But those studies stopped
at the coast.
Starting in the fall of 2003, Shakhova, Semiletov and the rest of their
team took the studies offshore. From 2003 through 2008, they took annual
research cruises throughout the shelf and sampled seawater at various depths
and the air 10 meters above the ocean. In September 2006, they flew a
helicopter over the same area, taking air samples at up to 2,000 meters in
the atmosphere. In April 2007, they conducted a winter expedition on the sea
ice. They found that more than 80 percent of the deep water and greater than
half of surface water had methane levels more than eight times that of
normal seawater. In some areas, the saturation levels reached at least 250
times that of background levels in the summer and 1,400 times higher in the
winter. They found corresponding results in the air directly above the ocean
surface. Methane levels were elevated overall and the seascape was dotted
with more than 100 hotspots. This, combined with winter expedition results
that found methane gas trapped under and in the sea ice, showed the team
that the methane was not only being dissolved in the water, it was bubbling
out into the atmosphere. These findings were further confirmed when Shakhova
and her colleagues sampled methane levels at higher elevations.
Methane levels throughout the Arctic are usually 8 to 10 percent higher
than the global baseline. When they flew over the shelf, they found methane
at levels another 5 to 10 percent higher than the already elevated arctic
levels. The East Siberian Arctic Shelf, in addition to holding large stores
of frozen methane, is more of a concern because it is so shallow. In deep
water, methane gas oxidizes into carbon dioxide before it reaches the
surface. In the shallows of the East Siberian Arctic Shelf, methane simply
doesn't have enough time to oxidize, which means more of it escapes into the
atmosphere. That, combined with the sheer amount of methane in the region,
could add a previously uncalculated variable to climate models.
"The release to the atmosphere of only one percent of the methane
assumed to be stored in shallow hydrate deposits might alter the current
atmospheric burden of methane up to 3 to 4 times...
Shahkova et.al., Extensive methane venting to the atmosphere from sediemnts
of the East Siberian Arctic Shelf, Science, March 2010.
http://www.sciencemag.org/content/327/5970/1246.abstract
March 2, 2010 Australia - Hottest Nine Months
Ever Recorded
Australian Bureau of Meteorology
March 1, 2010 A Warming Planet is Producing
More Allergens and More Allergic People Not in the
future, this is happening now. New research by a team from Italy
including Dr. Renato Ariano, director of the allergy service at
Bordighera Hospital in Italy shows that higher temperatures
and longer growing seasons are lengthening the pollination period for some
plants and trees. This increases the pollen load they produce and has caused
a rise in the number of people who are developing allergies. Doctor Ariano
and his team have accumulated 30 years of data about pollen counts and
number of patients. Their research was presented in New Orleans at the
annual meeting of the American Academy of Allergy, Asthma &
Immunology.
February 27, 2010 Russian Reindeer Herders
Having Huge Problems with Climate Change Warm winters
in recent years have caused reindeer herders to repeatedly delay the
rounding up of their herds. They have moved the slaughter from the
traditional time of December to February because the lakes are not freezing
over until then. The reindeer lose 20 percent of their weight during the
wait. The AFP report quotes Vladimir Filippov, an ethnic Komi herder "It's
not a small but a huge problem for us and a constant worry". Filipov said
the loss can be 167,000 dollars per year. More than a decade of mild winters
have affected the herders. They dismiss the skeptics pessimism about global
warming. Other issues are hampering the herds. Climate changes have
disrupted the breeding cycle. Freezing rain early in the snow season, when
traditionally there was only snow, forms as rock hard layer over the lichens
that the reindeer feed on. Reindeer (caribou) are in significant
decline because of climate change (see here).
"The vast degree of global change in the north casts doubt on the species'
ability to recover," study author Liv Vors of the University of Alberta,
Canada told AFP.
February 27, 2010 Zambia Farmers
Impacted by Climate Change (from an article in the Times of
Zambia)
&q"Farming has now become completely different and difficult," laments Dickson
Siangoma. Mr Siangoma is a headman at Malundu Village in Lusitu area of
Siavonga and is struck by the changing weather patterns and conditions that
have made farming a little less predictable and a high risk venture. He
wonders what has become of the world. "When the rain comes, it pours
continuously for almost a whole day causing damage to crops. The weather
pattern is in disarray. There is either too much rain causing floods,
destroying houses and washing away fields, roads and bridges or there is
drought. The situation is getting worse every day," he says. Small-scale
farmers have been hit the most because of their limited capacity to adapt.
But at the same time, unsustainable farming practices are said to contribute
to climate change, posing a great challenge to environmental sustainability,
particularly through deforestation as they continue to search for productive
agriculture farmlands. New evidence from a study from the International Food
Policy Research Institute (IFPRI) indicates that on-going extreme changes
and variability in Zambia's climate could bring losses of more than US$4
billion in agricultural income in the next 10 years, driving hundreds of
thousands into poverty and food insecurity.
Times of Zambia - complete report
February 26, 2010
Coffee Industry Impacted by
Warming Global Climate (from AFP) Coffee producers say they
are getting hammered by global warming, with higher temperatures forcing
growers to move to prized higher ground, putting the cash crop at risk.
"There is already evidence of important changes" said Nestor Osorio, head of
the International Coffee Organization (ICO), which represents 77 countries
that export or import the beans. "In the last 25 years the temperature has
risen half a degree in coffee producing countries, five times more than in
the 25 years before," he said.
February 26, 2010 Australian Farmers Adapting
to Climate Change Rather than Fighting Something that Is Not "Real"
This summary of a Australian CBS Documentary on agriculture in Australia.
"Many Australian farmers are accepting the variable nature of the weather
and adapting their practices to deal with climate change, rather than
getting caught up in the political debate on whether that change is natural
or man-made. Farmers say the lack of water and unpredictable weather
patterns over the last decade have already forced them to make major changes
to their operations, a case of adapt or perish."
http://www.abc.net.au/news/stories/2010/02/26/2831513.htm
February
24, 2010 Antarctic Ice Report from the USGS - authors
say "widely
regarded as among the most profound and unambiguous examples of the effects
of global warming yet seen on the planet"
Antarctica is shrinking and the rate of melt and ice discharge is
accelerating.
In the last 20 years an area of ice almost the size of Alaska has been lost.
Every ice front on the southern section of the peninsula has been
retreating from 1947 to 2009, with the most dramatic changes since 1990.This U.S. Geologic Survey report looked at satellite
imagery from 1947 to 2009 to analyze the location of the edge of ice in
Antarctica. By far most of the ice edge around Antarctica was shrinking. The
Antarctic Ice
Disappearing USGS Survey and report
February 23, 2010 Deep-Ocean Low-Oxygen Zones
Spreading to Shallower Coastal Waters This low oxygen
state of deep ocean waters is a normal thing, but what is not normal is the
encroachment of these waters into continental shelf waters. The phenomena is
happening more often around the world and is likely associated with climate
change. Why is this bad? Nothing can live in these waters. If living
organisms can not flee, they perish. These low to no oxygen waters have
increase by 1.7 million square miles since the 1970s. This is an area that
is nearly 3 times the size of Alaska. species that can flee are encountering
different environments. Ecological diversity is stressed and ultimately
diminished because of the shrinking survivable habitat.
Strama et.al., Ocean oxygen minima expansions and their biological impacts,
Deep Sea Research Part I: Oceanographic Research Papers February 2010class="style40">
February 20, 2010 Never Seen Anything Like It
(Climategate) F
February 22, 2010 CU-Boulder Prof
Boykoff
Speaks on Mass Media Role in Climate Change
Skepticism - It Is Not All the Media's Fault, But They Play a Big
Role From the CU Press Release: "One problem occurs
when outlier viewpoints are not individually evaluated in context,"
said Boykoff. "A variety of influences and perspectives typically
have been collapsed by mass media into one general category of
skepticism. This has been detrimental both in terms of dismissing
legitimate critiques of climate science or policy, as well as
amplifying extreme and tenuous claims." Such claims are amplified
when traditional news media position noncredible contrarian sources
against those with scientific data, in a failed effort to represent
opposing sides, said Boykoff.
February 16, 2010 Oceans Acidifying Ten Times
Faster Today Than at any Time in the Last 65 Million Years
Oceans are acidifying ten times faster today than during the mass ocean
extinction that happened 55 million years ago. A study by two University of
Bristol scientists has bad enough news for the present, but as we continue
this hyper-acidification event, these scientists are concerned that the
coming extinction event will be greater than the one at 55 million years
ago. This discovery was made from the study of a sediment core with a bright
red swath running through the middle of it. What happened 55 million
years ago was that there was a massive release of greenhouse gases, likely
from frozen methane on the ocean floor. The resulting acidification of
the oceans created an oxidizing chemistry that precipitated a lot of iron
out of the ocean waters. This iron precipitate, or rust, caused the sediment
to turn red, and there was a great extinction event.
The distinction between 55 million years ago and 65 million years ago is
that 65 million years ago the giant asteroid hit the Yucatan peninsula. the
extinction event that occurred then was greater than the one at 55 million
years ago and consequently ocean acidification was greater. It is unclear
from this study whether or not we are changing faster than 65 million years
ago, but it is not unclear that we are changing 10 times faster than 55
million years ago.
February 16, 2010 Greenland Melt Increases -
Warmer Ocean Water Melts 100 Times More Than Surface Melt
TwTwo new articles in Nature Geoscience describe greater melting from
under ice sea water in fjords. A team headed by Woods Hole
oceanographer Straneo Fiammetta found, as their discovery paper implies,
warm subtropical waters circulating beneath Helhiem Glacier in the Sermilik
Fjord, East Greenland. the warm waters come from the Atlantic Ocean east of
Greenland where a changing climate has shifted ocean currents and wind
patterns. Accelerated melting from underneath increases glacial discharge
which is the main mode of ice discharge from Greenland. In another study by
Eric Rignot and his team from the University of California, the Jet
Propulsion Laboratory and the University of British Columbia looked at four
glaciers on the west coast of Greenland. the study found that the warm
waters are melting 100 times more water than surface melt. Rignot and his
team say "...submarine melting must have a profound influence on
grounding-line stability and ice-flow dynamics."
When I visited Illulisat on the West Coast of Greenland, I met Dr, David
Holland of the University of New York. Dr. Holland pioneered under-ice
investigation in Greenland fjords. He had this little submersible probe that
he somehow piloted beneath the iceberg crammed waters of the Jakobhaven
Isbrea from a helicopter. class="style40">
Fiammetta, et. al., Rapid circulation of warm subtropical waters in a major
glacial fjord in East Greenland Nature Geoscience, February 2010.
February 15, 2010 Great Lakes Ice Season
Decreasing Significantly Despite Claims by Skeptics Every
year or two, one or more of the Great Lakes will freeze over and ignite a
winter storm of fury about how the Algorians are wrong again. The Great
Lakes are freezing over so the Warmongers must be wrong. The reality of course
is that our planet is warming and it is warming faster today that it was a
decade or three ago. When I saw the skeptics alarm about Lake Erie
freezing over I instinctively started Googling "Great Lakes freeze up
history". This time I ran across an apparent indicator of total Great Lake
ice season length, or so this is what the author says. I will just reprint
the entire abstract here, it is quite a telling piece of work.
Apparently the ice season on the Lakes is 45 days shorter today than it was
150 years ago and the rate of decrease of ice coverage has been greatest in
the last couple of decades.
"This research documents a 150-year record pertaining to the duration of
closed navigation for Bayfield harbor. Data were gathered recording the
opening and closing of navigation in Bayfield, Wisconsin from 1857–2007.
Data were primarily collected from the Madeline Island Ferry Line and
microfilmed copies of the Bayfield County Press. Analysis of the data
indicates that the duration of ice cover on Lake Superior at Bayfield,
Wisconsin has decreased over the past 150 years at the rate of approximately
3 days/decade or 45 days over the course of the study. During the past 150
years, the date that the last boat is able to navigate in the Bayfield
harbor indicates the onset of ice cover. This date has occurred an average
of 1.6 days later every decade. Conversely, the date that the first boat is
able to navigate in Bayfield harbor marking the break up of ice cover has
come to an average of 1.7 days earlier every decade. Although this
represents the overall trend for the past century and a half, the most
dramatic changes have occurred since 1975. During this period the ice season
has begun an average of 11.7 days later and ended 3.0 days earlier every
decade. Bayfield's ice season was compared to the lake's annual maximum ice
concentration (AMIC) as compiled in a study by [Assel,
R.A., Cronk, K., and Norton, D. 2003. Recent trends in
Laurentian Great Lakes ice cover, Climatic Change 57: 185–204, 2003.] The
fraction of the potential closed navigation season that the Bayfield harbor
is ice covered decreased at a rate of 0.77% a year while the AMIC decreased
at a rate of 0.39% / year during the period from 1964–2001. In general, the
decline in the ice cover at Bayfield mirrors the pattern shown by the AMIC,
suggesting that Bayfield's ice season could be used as a nonspecific
indicator of overall lake trends."
February 14, 2009 A Few Words to the Radical
Skeptics from the Acting Director of East Anglia
University: "The
evidence is hugely for there being substantial climate change due to man's
activities and if you want to argue against that case you have to produce
some evidence... I don't see that evidence, I see lots of assertion but it's
not backed up. It's very dangerous and like playing Russian roulette with
the planet... "This is not just some intellectual argument between people
who think they know the answer, we are talking about the future of the
globe. "If you're on the climate skeptics side, you have to have really good
evidence for your case because if you're wrong then the consequences for all
of us and all our children and whoever comes after is hugely influenced."
Prof Peter Liss is the acting director of the University of East Anglia's
Climatic Research Unit. (From
the Telegraph)
Another statement from a senior researcher concerning the current
controversies over details in the IPCC 2007 report: "... such uncertainties
are irrelevant to whether we need to reduce greenhouse gas emissions
dramatically as soon as possible. There is no uncertainty that the
consequences of climate change will be severe for global society, and
therefore for us as members of that global society. The consequences for any
individual may come through the direct effect of changes in local climate or
it may come through changes to the working of, and stability of, global
economic systems. Whatever the case, climate change represents a future of
much increased risk. We would do well to act now to minimize those risks."
David Stainforth is a senior research fellow at the
Grantham
Research Institute on Climate Change and the Environment at the London
School of Economics and Political Science.
Fiction from Utah House of Representatives?
No, this is real. In a non-binding resolution form the states
Legislature, the original version of contained these quotes: "...well
organized and ongoing effort to manipulate and incorporate "tricks" related
to global temperature data in order to produce a global warming outcome". It
said climate researchers were riding a "gravy train (that would) ultimately
lock billions of human beings into long-term poverty". This Guardian Report
stated that, in the heat of the debate, the representative Mike Noel said
environmentalists were part of a vast conspiracy to destroy the American way
of life and control world population through forced sterilization and
abortion. (here)
And Yes, Climate Change is Responsible for the Increased Snow Events
in the Northeast, Maybe Not Vancouver. Our planet has warmed,
this increases the energy in storms. Westerlies winds have decreased in both
hemispheres. This creates greater variability in the intensity of storms and
shifts the jet stream and thus the paths of storms. It is warmer - all of
these storms in the northeast have occurred with temperatures right around
the freezing point. This allows more moisture to be involved with the storms
because warmer air holds more water. Three natural cycles, all in the
their cool phases have just ended. All of them have time lags, so the
influence of their cooling is still being felt. The scientists repeat their
findings over and over again, year after year, yet the groundhogs continue
to have their day. The 2007 IPCC says that there will be more, and more
intense snowstorms on a warmer planet. Vancouver - I like to say that all
weather today is caused by climate change because our climate has changed,
therefor none of the weather can be caused by our old climate. This is of
course the "beyond a reasonable doubt" understanding of climate. If we look
at the statistics however, Vancouver is hanging on El Nino like a longboared
hanging on a right-hand curl. The last time this happened was during the
super El Nino back in '98. Hints of things to come this summer?
February 12, 2009 Sea Level Rises Much Faster
than Previously Understood. A new publication in the
Journal Science by Dorale et. al., looked sporadically submerged
cave formations on the coast of Spain. Dr. Dorale says in an article in
Time: "Dorale's paper suggests the possibility that ice sheets may
respond much more dynamically to changes in temperature, forming and melting
at rates that are quicker than previously thought. "There might be a
feedback with regards to ice melting," says Dorale. "This is speculation,
but it might point at some sort of catastrophic ice sheet dynamic."
Dorale, et. al., Sea-Level Highstand 81,000 Years Ago in Mallorca, Science,
February 2010.
February 11, 2010 Eighty Two Species of Coral
listed in a Petition for Endangerement under the Endangered Species Act
This is a very significant petition, more of which
will likely follow in the unexpectedly near future. It is this kind of
species reduction and species
The February 10 Federal Register published a petition for this extensive
listing citing the number one reason as warming oceans due to climate
change. The petition states that all of the petitioned species have suffered
losses of 30% or more over a 30-year period placing them at high risk of
extinction according to the IUCN guidelines (International Union for
the Conservation of Nature). The petition continues "...the
region suffered massive losses of corals in response to climate-related
events of 2005, including a record-breaking series of 26 tropical storms and
elevated ocean water temperatures". The petition goes on "...the U.S. Virgin
Islands lost 51.5 percent of live coral cover, and that Florida, Puerto
Rico, the Cayman Islands, St. Maarten, Saba, St. Eustatius, Guadeloupe,
Martinique, St. Barthelemy, Barbados, Jamaica, and Cuba suffered bleaching
of over 50 percent of coral colonies, citing Carpenter et al. (2008). The
petitioner cites Gardner et al. (2003) in asserting that, over the three
decades prior to the 2005 events, Caribbean reefs had already suffered an 80
percent decline in hard coral cover, from an average of 50 percent to an
average of 10 percent throughout the region."
The most alarming statement in the petition follows: "... these corals face
significant threats. To support this assertion, the petitioner cites
Alvarez-Filip et al. (2009) in noting the dramatic decline of the three
dimensional complexity of Caribbean reefs over the past 40 years, resulting
in a phase shift from a coral-dominated ecosystem to fleshy macroalgal
overgrowth in reef systems across the Caribbean." This "fleshy
macroalgal overgrowth" - what this means is that most of the corals have
died and have been replaced by a green or brown slime of algae.
February 10, 2010 Thoreau's Walden Pond
Significantly Impacted by Climate Change This was a very
interesting study. Harvard University scientists have compared the
meticulous notes kept by Thoreau's at Walden pond to the site today. Their
results show that climate change has had a definite impact. In a prepared
statement, one of the authors (C. Davis) says "These results
demonstrate for the first time that climate change likely plays a direct
role in promoting non-native species success ... they highlight the
importance of flowering time as a trait that may facilitate the success of
non-native species. This kind of information could be very useful for
predicting the success of future invaders." Thoreau's recordkeeping comes
from 150 years ago, at a time when modern climate change had not begun to
have any impacts on native landscapes and invasive species were relatively
unknown.
The average temperature around Walden Pond has increased by 4.3 degrees
Fahrenheit, causing some plants to flowering time by as much as three weeks
early. The study also found that 27 percent of all species Thoreau recorded
from 1851 to 1858 have become locally extinct, and 36 percent are so rare
that extinction could be imminent.
Eureka Alert Service:
http://www.eurekalert.org/pub_releases/2010-02/hu-ipa020310.php
Willis, et. al., Favorable climate change response explains non-native
species success in Thoreau's woods, PLosOne, February 2010.
Breaking News Archive February 9, 2010
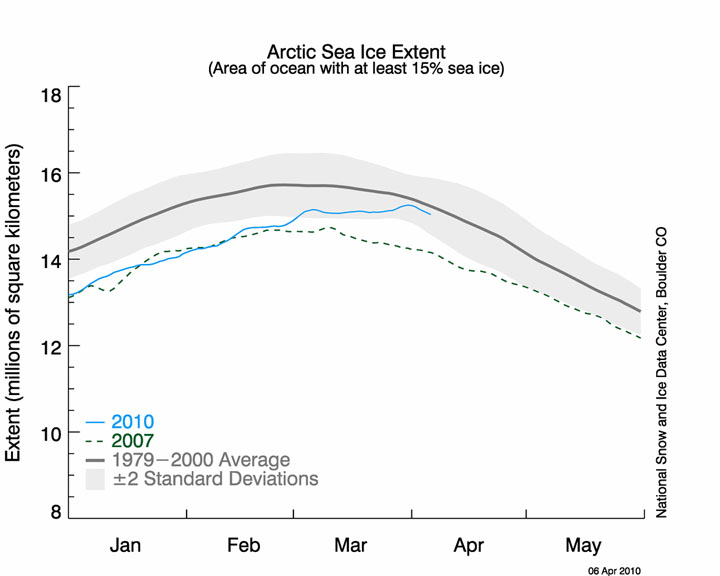 but
nothing more than natural chaos. Northern Canada had a very warm
winter, so warm that the harp seal crop in the Gulf of St. Lawrence in
eastern Canada, was saved. In 1987 Canada banned the harvest of the
baby harp seals with their white coats, but adult harvest has continued. The
white pups caused world tumult when it was made common knowledge that
the hunters walked out on the sea ice and clubbed the seal pups to death.
Well, this year there was little to no sea ice (an exceedingly rare
condition) so no clubbing took place
and the seals were saved? Harp seals are one of those ice dependant seals,
they calve and raise their pups on the ice, so what happens when there is no
ice as happened this year? This clip from the Canadian Press,
and a short quote from Mark Serreze at the US National Snow and Ice Data
Center says what the propaganda machine would rather the public not know
about Arctic sea ice this year:
but
nothing more than natural chaos. Northern Canada had a very warm
winter, so warm that the harp seal crop in the Gulf of St. Lawrence in
eastern Canada, was saved. In 1987 Canada banned the harvest of the
baby harp seals with their white coats, but adult harvest has continued. The
white pups caused world tumult when it was made common knowledge that
the hunters walked out on the sea ice and clubbed the seal pups to death.
Well, this year there was little to no sea ice (an exceedingly rare
condition) so no clubbing took place
and the seals were saved? Harp seals are one of those ice dependant seals,
they calve and raise their pups on the ice, so what happens when there is no
ice as happened this year? This clip from the Canadian Press,
and a short quote from Mark Serreze at the US National Snow and Ice Data
Center says what the propaganda machine would rather the public not know
about Arctic sea ice this year:
1. Climate change is defined as any significant variation in climate
measures—precipitation, temperature, wind—for an extended period, usually
decades or longer.
2. Global warming is a rise in the average temperature of Earth's surface.
3. In order to estimate temperatures of the past, scientists analyze "proxy"
indicators such as tree rings, ice cores, and ocean sediment.
4. A French mathematician, Jean Baptiste Joseph Fourier, was the first to
recognize a gradual warming of Earth in 1824.
etc., etc...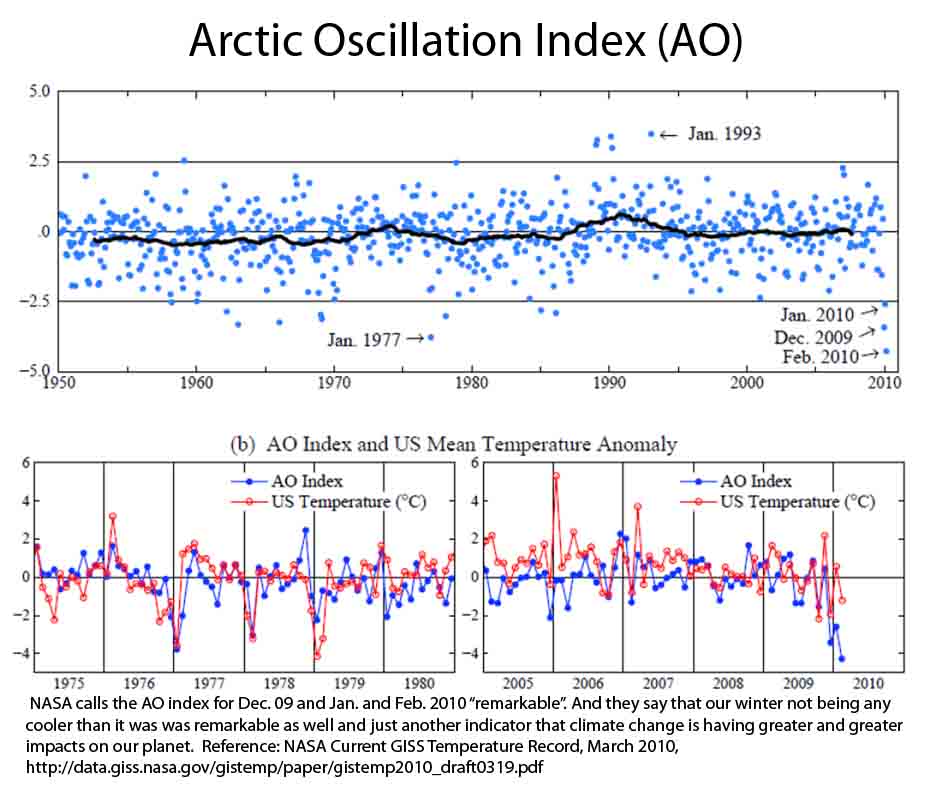 and
the extra warm southern hemisphere. The results are that we will likely set
a global high temperature record this year.
and
the extra warm southern hemisphere. The results are that we will likely set
a global high temperature record this year.
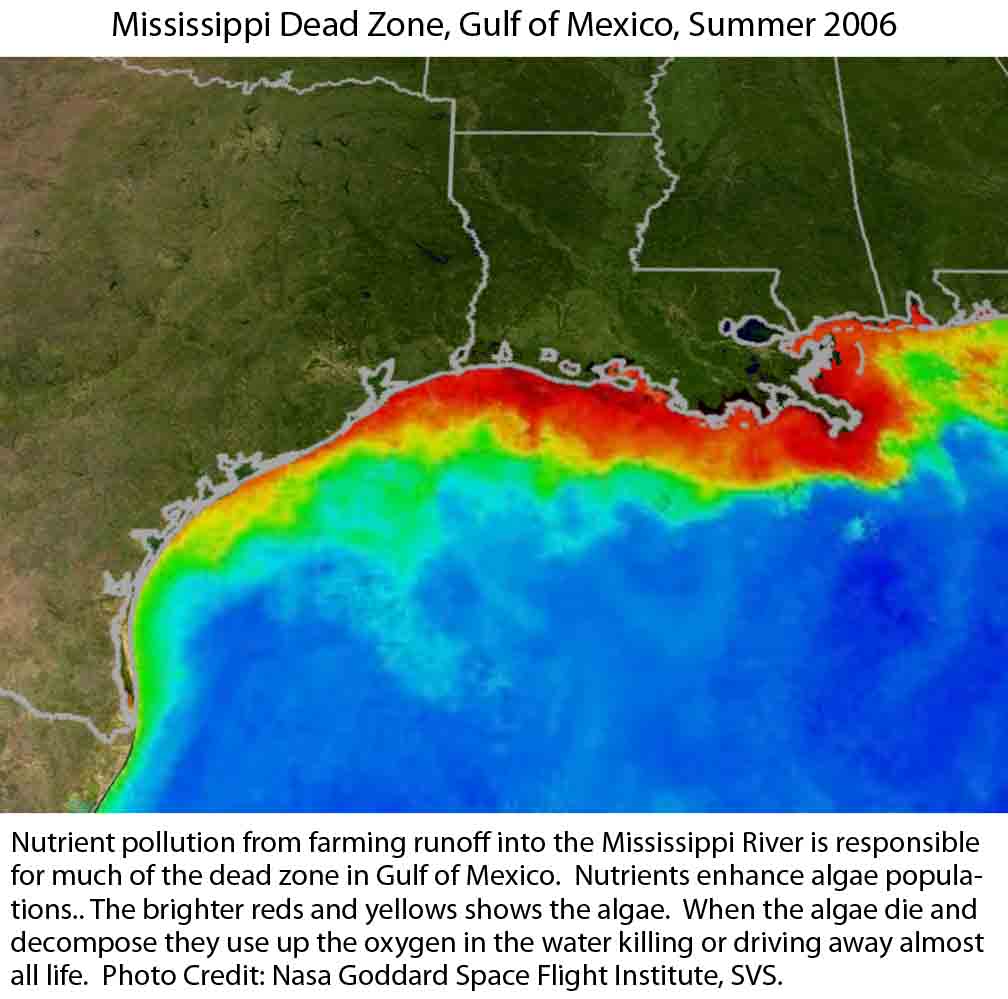 processes.
Dead Zones are getting worse and worse because of nutrient pollution, but
many new dead zones have been discovered that have nothing to do with dead
zones. these areas are believed to have been caused by shifting ocean
currents - currents that are changing because of climate change.
processes.
Dead Zones are getting worse and worse because of nutrient pollution, but
many new dead zones have been discovered that have nothing to do with dead
zones. these areas are believed to have been caused by shifting ocean
currents - currents that are changing because of climate change.
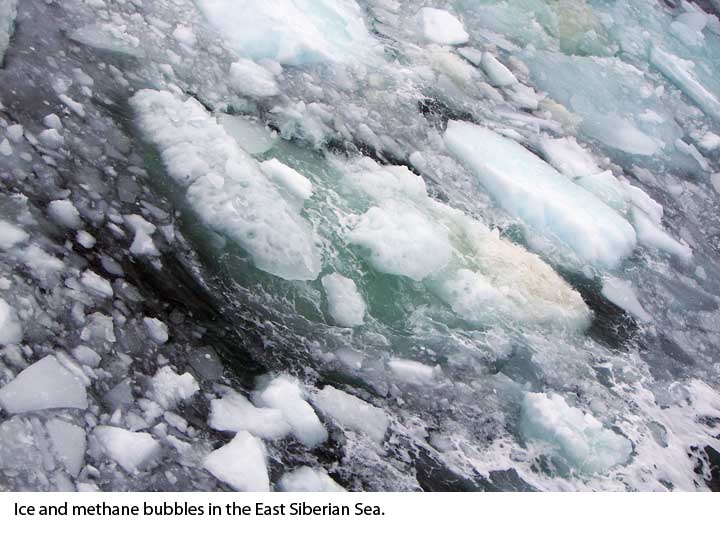 that
holds vast stores of frozen methane is showing signs of instability and
widespread venting of the powerful greenhouse gas, according to the findings
of an international research team led by University of Alaska Fairbanks
scientists Natalia Shakhova and Igor Semiletov. The research results,
published in the March 5 edition of the journal Science, show that the
permafrost under the East Siberian Arctic Shelf, long thought to be an
impermeable barrier sealing in methane, is perforated and is leaking large
amounts of methane into the atmosphere.
that
holds vast stores of frozen methane is showing signs of instability and
widespread venting of the powerful greenhouse gas, according to the findings
of an international research team led by University of Alaska Fairbanks
scientists Natalia Shakhova and Igor Semiletov. The research results,
published in the March 5 edition of the journal Science, show that the
permafrost under the East Siberian Arctic Shelf, long thought to be an
impermeable barrier sealing in methane, is perforated and is leaking large
amounts of methane into the atmosphere.
 (From the Australian Bureau of Meteorology) The summer of 2009-10 was a
rather wet one for most of Australia, particularly in the east, continuing a
sequence in which eight of the last eleven summers have ranked in the
wettest 20 of the last 110 years. It was also a warmer-than-normal summer,
which combined with the extremely warm winter and spring to leave Australia
with its warmest nine months on record. The heat was most concentrated in
Western Australia, which had its hottest summer on record, but the southeast
was also warmer than normal.
(From the Australian Bureau of Meteorology) The summer of 2009-10 was a
rather wet one for most of Australia, particularly in the east, continuing a
sequence in which eight of the last eleven summers have ranked in the
wettest 20 of the last 110 years. It was also a warmer-than-normal summer,
which combined with the extremely warm winter and spring to leave Australia
with its warmest nine months on record. The heat was most concentrated in
Western Australia, which had its hottest summer on record, but the southeast
was also warmer than normal.
 authors say "The changes exhibited in
 the region are widely regarded
as among the most profound and unambiguous examples of the effects of global
warming yet seen on the planet." Since 1998, the ice lost
from
just one of the five ice shelves in the study totals more than 1,500 square
miles, an area larger than the state of Rhode Island.
the region are widely regarded
as among the most profound and unambiguous examples of the effects of global
warming yet seen on the planet." Since 1998, the ice lost
from
just one of the five ice shelves in the study totals more than 1,500 square
miles, an area larger than the state of Rhode Island.
CU Press Release
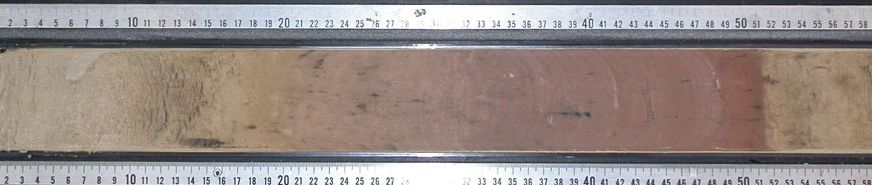 extinction
risk that will only accelerate in the future as our planet continues to warm
even faster than it has been warming recently. Species across the globe will
find themselves trying to survive in hostile environments. It will be very
difficult for most species, that evolved in a stable environments over
thousands of years, to adapt to habitats that have changed far beyond the
individual species evolutionary niche.
extinction
risk that will only accelerate in the future as our planet continues to warm
even faster than it has been warming recently. Species across the globe will
find themselves trying to survive in hostile environments. It will be very
difficult for most species, that evolved in a stable environments over
thousands of years, to adapt to habitats that have changed far beyond the
individual species evolutionary niche.