Strama et.al., Ocean oxygen minima expansions and their biological impacts,
Deep Sea Research Part I: Oceanographic Research Papers February 2010class="style40">
February 20, 2010 Never Seen Anything Like It
(Climategate)
F
February 22, 2010 CU-Boulder Prof
Boykoff
Speaks on Mass Media Role in Climate Change
Skepticism - It Is Not All the Media's Fault, But They Play a Big
Role From the CU Press Release: "One problem occurs
when outlier viewpoints are not individually evaluated in context,"
said Boykoff. "A variety of influences and perspectives typically
have been collapsed by mass media into one general category of
skepticism. This has been detrimental both in terms of dismissing
legitimate critiques of climate science or policy, as well as
amplifying extreme and tenuous claims." Such claims are amplified
when traditional news media position noncredible contrarian sources
against those with scientific data, in a failed effort to represent
opposing sides, said Boykoff.
CU Press Release
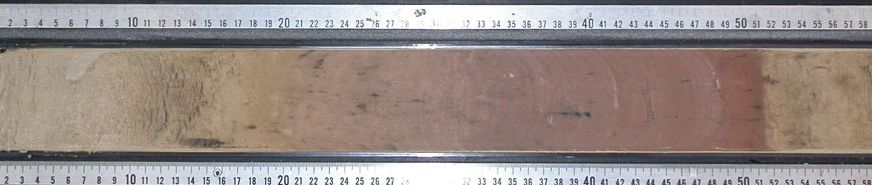
February 16, 2010 Oceans Acidifying Ten Times
Faster Today than at any Time in the Last 65 Million Years
Oceans are acidifying ten times faster today than during the mass ocean
extinction that happened 55 million years ago. A study by two University of
Bristol scientists has bad enough news for the present, but as we continue
this hyper-acidification event, these scientists are concerned that the
coming extinction event will be greater than the one at 55 million years
ago. This discovery was made from the study of a sediment core with a bright
red swath running through the middle of it. What happened 55 million
years ago was that there was a massive release of greenhouse gases, likely
from frozen methane on the ocean floor. The resulting acidification of
the oceans created an oxidizing chemistry that precipitated a lot of iron
out of the ocean waters. This iron precipitate, or rust, caused the sediment
to turn red, and there was a great extinction event.
The distinction between 55 million years ago and 65 million years ago is
that 65 million years ago the giant asteroid hit the Yucatan peninsula. the
extinction event that occurred then was greater than the one at 55 million
years ago and consequently ocean acidification was greater. It is unclear
from this study whether or not we are changing faster than 65 million years
ago, but it is not unclear that we are changing 10 times faster than 55
million years ago.
Ridgewell and Schmidt, Past constraints on the vulnerability of marine
calcifiers to massive carbon dioxide release, Nature Geoscience, February
2010.
February 16, 2010 Greenland Melt Increases -
Warmer Ocean Water Melts 100 Times More Than Surface Melt
TwTwo new articles in Nature Geoscience describe greater melting from
under ice sea water in fjords. A team headed by Woods Hole
oceanographer Straneo Fiammetta found, as their discovery paper implies,
warm subtropical waters circulating beneath Helhiem Glacier in the Sermilik
Fjord, East Greenland. the warm waters come from the Atlantic Ocean east of
Greenland where a changing climate has shifted ocean currents and wind
patterns. Accelerated melting from underneath increases glacial discharge
which is the main mode of ice discharge from Greenland. In another study by
Eric Rignot and his team from the University of California, the Jet
Propulsion Laboratory and the University of British Columbia looked at four
glaciers on the west coast of Greenland. the study found that the warm
waters are melting 100 times more water than surface melt. Rignot and his
team say "...submarine melting must have a profound influence on
grounding-line stability and ice-flow dynamics."
When I visited Illulisat on the West Coast of Greenland, I met Dr, David
Holland of the University of New York. Dr. Holland pioneered under-ice
investigation in Greenland fjords. He had this little submersible probe that
he somehow piloted beneath the iceberg crammed waters of the Jakobhaven
Isbrea from a helicopter. class="style40">
Fiammetta, et. al., Rapid circulation of warm subtropical waters in a major
glacial fjord in East Greenland Nature Geoscience, February 2010.
Rignot, et. al., Rapid submarine melting of the calving faces of West
Greenland glaciers, Nature Geoscience, February 2010.
February 15, 2010 Great Lakes Ice Season
Decreasing Significantly Despite Claims by Skeptics Every
year or two, one or more of the Great Lakes will freeze over and ignite a
winter storm of fury about how the Algorians are wrong again. The Great
Lakes are freezing over so the Warmongers must be wrong. The reality of course
is that our planet is warming and it is warming faster today that it was a
decade or three ago. When I saw the skeptics alarm about Lake Erie
freezing over I instinctively started Googling "Great Lakes freeze up
history". This time I ran across an apparent indicator of total Great Lake
ice season length, or so this is what the author says. I will just reprint
the entire abstract here, it is quite a telling piece of work.
Apparently the ice season on the Lakes is 45 days shorter today than it was
150 years ago and the rate of decrease of ice coverage has been greatest in
the last couple of decades.
"This research documents a 150-year record pertaining to the duration of
closed navigation for Bayfield harbor. Data were gathered recording the
opening and closing of navigation in Bayfield, Wisconsin from 1857–2007.
Data were primarily collected from the Madeline Island Ferry Line and
microfilmed copies of the Bayfield County Press. Analysis of the data
indicates that the duration of ice cover on Lake Superior at Bayfield,
Wisconsin has decreased over the past 150 years at the rate of approximately
3 days/decade or 45 days over the course of the study. During the past 150
years, the date that the last boat is able to navigate in the Bayfield
harbor indicates the onset of ice cover. This date has occurred an average
of 1.6 days later every decade. Conversely, the date that the first boat is
able to navigate in Bayfield harbor marking the break up of ice cover has
come to an average of 1.7 days earlier every decade. Although this
represents the overall trend for the past century and a half, the most
dramatic changes have occurred since 1975. During this period the ice season
has begun an average of 11.7 days later and ended 3.0 days earlier every
decade. Bayfield's ice season was compared to the lake's annual maximum ice
concentration (AMIC) as compiled in a study by [Assel,
R.A., Cronk, K., and Norton, D. 2003. Recent trends in
Laurentian Great Lakes ice cover, Climatic Change 57: 185–204, 2003.] The
fraction of the potential closed navigation season that the Bayfield harbor
is ice covered decreased at a rate of 0.77% a year while the AMIC decreased
at a rate of 0.39% / year during the period from 1964–2001. In general, the
decline in the ice cover at Bayfield mirrors the pattern shown by the AMIC,
suggesting that Bayfield's ice season could be used as a nonspecific
indicator of overall lake trends."
Howk, Changes in Lake Superior Ice Cover at Bayfield, Wisconsin, Journal of
Great Lakes Research, September 2008.
February 14, 2009 A Few Words to the Radical
Skeptics from the Acting Director of East Anglia
University: "The
evidence is hugely for there being substantial climate change due to man's
activities and if you want to argue against that case you have to produce
some evidence... I don't see that evidence, I see lots of assertion but it's
not backed up. It's very dangerous and like playing Russian roulette with
the planet... "This is not just some intellectual argument between people
who think they know the answer, we are talking about the future of the
globe. "If you're on the climate skeptics side, you have to have really good
evidence for your case because if you're wrong then the consequences for all
of us and all our children and whoever comes after is hugely influenced."
Prof Peter Liss is the acting director of the University of East Anglia's
Climatic Research Unit. (From
the Telegraph)
Another statement from a senior researcher concerning the current
controversies over details in the IPCC 2007 report: "... such uncertainties
are irrelevant to whether we need to reduce greenhouse gas emissions
dramatically as soon as possible. There is no uncertainty that the
consequences of climate change will be severe for global society, and
therefore for us as members of that global society. The consequences for any
individual may come through the direct effect of changes in local climate or
it may come through changes to the working of, and stability of, global
economic systems. Whatever the case, climate change represents a future of
much increased risk. We would do well to act now to minimize those risks."
David Stainforth is a senior research fellow at the
Grantham
Research Institute on Climate Change and the Environment at the London
School of Economics and Political Science.
Fiction from Utah House of Representatives?
No, this is real. In a non-binding resolution form the states
Legislature, the original version of contained these quotes: "...well
organized and ongoing effort to manipulate and incorporate "tricks" related
to global temperature data in order to produce a global warming outcome". It
said climate researchers were riding a "gravy train (that would) ultimately
lock billions of human beings into long-term poverty". This Guardian Report
stated that, in the heat of the debate, the representative Mike Noel said
environmentalists were part of a vast conspiracy to destroy the American way
of life and control world population through forced sterilization and
abortion. (here)
And Yes, Climate Change is Responsible for the Increased Snow Events
in the Northeast, Maybe Not Vancouver. Our planet has warmed,
this increases the energy in storms. Westerlies winds have decreased in both
hemispheres. This creates greater variability in the intensity of storms and
shifts the jet stream and thus the paths of storms. It is warmer - all of
these storms in the northeast have occurred with temperatures right around
the freezing point. This allows more moisture to be involved with the storms
because warmer air holds more water. Three natural cycles, all in the
their cool phases have just ended. All of them have time lags, so the
influence of their cooling is still being felt. The scientists repeat their
findings over and over again, year after year, yet the groundhogs continue
to have their day. The 2007 IPCC says that there will be more, and more
intense snowstorms on a warmer planet. Vancouver - I like to say that all
weather today is caused by climate change because our climate has changed,
therefor none of the weather can be caused by our old climate. This is of
course the "beyond a reasonable doubt" understanding of climate. If we look
at the statistics however, Vancouver is hanging on El Nino like a longboared
hanging on a right-hand curl. The last time this happened was during the
super El Nino back in '98. Hints of things to come this summer?
February 12, 2009 Sea Level Rises Much Faster
than Previously Understood. A new publication in the
Journal Science by Dorale et. al., looked sporadically submerged
cave formations on the coast of Spain. Dr. Dorale says in an article in
Time: "Dorale's paper suggests the possibility that ice sheets may
respond much more dynamically to changes in temperature, forming and melting
at rates that are quicker than previously thought. "There might be a
feedback with regards to ice melting," says Dorale. "This is speculation,
but it might point at some sort of catastrophic ice sheet dynamic."
Dorale, et. al., Sea-Level Highstand 81,000 Years Ago in Mallorca, Science,
February 2010.
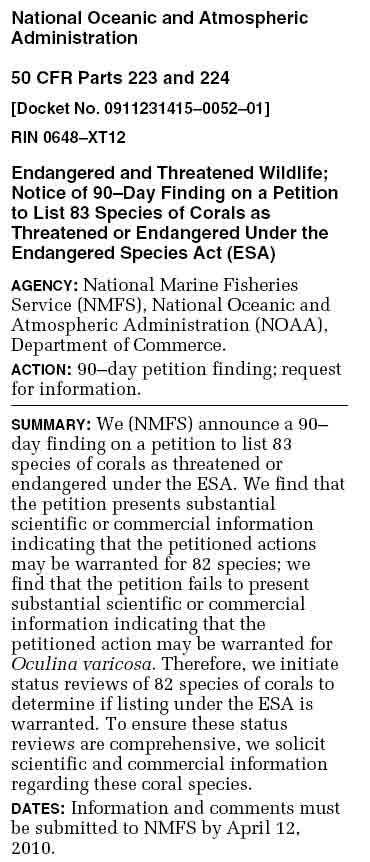
February 11, 2010 Eighty Two Species of Coral
listed in a Petition for Endangerement under the Endangered Species Act
This is a very significant petition, more of which
will likely follow in the unexpectedly near future. It is this kind of
species reduction and species
 extinction
risk that will only accelerate in the future as our planet continues to warm
even faster than it has been warming recently. Species across the globe will
find themselves trying to survive in hostile environments. It will be very
difficult for most species, that evolved in a stable environments over
thousands of years, to adapt to habitats that have changed far beyond the
individual species evolutionary niche.
extinction
risk that will only accelerate in the future as our planet continues to warm
even faster than it has been warming recently. Species across the globe will
find themselves trying to survive in hostile environments. It will be very
difficult for most species, that evolved in a stable environments over
thousands of years, to adapt to habitats that have changed far beyond the
individual species evolutionary niche.
The February 10 Federal Register published a petition for this extensive
listing citing the number one reason as warming oceans due to climate
change. The petition states that all of the petitioned species have suffered
losses of 30% or more over a 30-year period placing them at high risk of
extinction according to the IUCN guidelines (International Union for
the Conservation of Nature). The petition continues "...the
region suffered massive losses of corals in response to climate-related
events of 2005, including a record-breaking series of 26 tropical storms and
elevated ocean water temperatures". The petition goes on "...the U.S. Virgin
Islands lost 51.5 percent of live coral cover, and that Florida, Puerto
Rico, the Cayman Islands, St. Maarten, Saba, St. Eustatius, Guadeloupe,
Martinique, St. Barthelemy, Barbados, Jamaica, and Cuba suffered bleaching
of over 50 percent of coral colonies, citing Carpenter et al. (2008). The
petitioner cites Gardner et al. (2003) in asserting that, over the three
decades prior to the 2005 events, Caribbean reefs had already suffered an 80
percent decline in hard coral cover, from an average of 50 percent to an
average of 10 percent throughout the region."
The most alarming statement in the petition follows: "... these corals face
significant threats. To support this assertion, the petitioner cites
Alvarez-Filip et al. (2009) in noting the dramatic decline of the three
dimensional complexity of Caribbean reefs over the past 40 years, resulting
in a phase shift from a coral-dominated ecosystem to fleshy macroalgal
overgrowth in reef systems across the Caribbean." This "fleshy
macroalgal overgrowth" - what this means is that most of the corals have
died and have been replaced by a green or brown slime of algae.
Federal
Register Link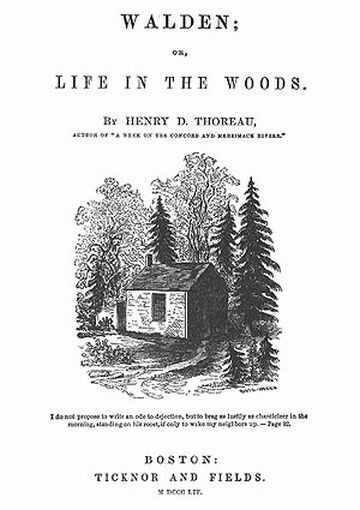
February 10, 2010 Thoreau's Walden Pond
Significantly Impacted by Climate Change This was a very
interesting study. Harvard University scientists have compared the
meticulous notes kept by Thoreau's at Walden pond to the site today. Their
results show that climate change has had a definite impact. In a prepared
statement, one of the authors (C. Davis) says "These results
demonstrate for the first time that climate change likely plays a direct
role in promoting non-native species success ... they highlight the
importance of flowering time as a trait that may facilitate the success of
non-native species. This kind of information could be very useful for
predicting the success of future invaders." Thoreau's recordkeeping comes
from 150 years ago, at a time when modern climate change had not begun to
have any impacts on native landscapes and invasive species were relatively
unknown.
The average temperature around Walden Pond has increased by 4.3 degrees
Fahrenheit, causing some plants to flowering time by as much as three weeks
early. The study also found that 27 percent of all species Thoreau recorded
from 1851 to 1858 have become locally extinct, and 36 percent are so rare
that extinction could be imminent.
Eureka Alert Service:
http://www.eurekalert.org/pub_releases/2010-02/hu-ipa020310.php
Willis, et. al., Favorable climate change response explains non-native
species success in Thoreau's woods, PLosOne, February 2010.
February 9, 2010 Northern forests soils emit
twice the carbon as previously understood Northern forest
soils, unlike tropical forest soils, are immense storehouses of carbon. It
has always been understood that a warming planet will dry the forests of
most of the world. This dryness will cause the liberation, or oxidation of
much of the northern forests soils carbon. This carbon has been placed
there over the millennia and even 10s of millennia as root material, decaying
leaf and needle litter, peat in the form of partially decomposed plant
material and carbon compounds incorporated into the soil through the many
reactions and interactions of microorganisms. Northern forest of
the world in fact store almost twice as much carbon as tropical forests. And
the big threat is that northern climates are affected by the polar
amplification effect. Significant climate change is already happening in
the north. Climate models in the past have miscalculated the possible
carbon response from northern forest soils as the world warms and dries. The
authors say that their results suggest that there is an increased risk of a
positive feedback to climate change related to the soil carbon cycle.
Temperature sensitivity of soil carbon fractions in boreal forest soil,” by
Kristiina Karhu, Hannu Fritze, Kai Hämäläinen, Pekka Vanhala, Högne Jungner,
Markku Oinonen, Eloni Sonninen, Mikko Tuomi, Peter Spetz, Veikko Kitunen,
and Jari Liski, Ecology 91(2), February 2010.
February 5, 2010 Big Mistake in Arctic Sea Ice
Calculations - Unexpected Arctic Melt Found to be
Even Further Ahead of Projections than Recently Understood. 370
scientists from 27 countries around the world spent last winter on the first
ship of its kind (research vessel) ever to remain mobile in the Arctic during
the winter season. What they found was that Arctic sea ice is decaying "...much
faster than their most pessimistic models predict". ( The Winnipeg Free
Press Interview says this quote is from Dr. David Barber, University of
Manitoba and lead Principle Investigator for the research mission.) In other words,
their most pessimistic model is the worst-case scenario, so Arctic sea
ice is decaying much worse than the worst-case scenario. Our understanding of the polar
amplification effect and the actual ongoing decay of Arctic sea ice has changed
radically in the last five years. Just after the turn of the century, scientists
still understood that it would likely be much closer to the year 2100 before we saw ice free
conditions in the Arctic. The consensus position today is between 2013 and 2030
(see here and
here and
here). Snow
and ice are very important temperature regulators on Earth. Snow reflects almost
all of the sun's energy harmlessly back into space. Open water absorbs almost
all of the suns energy and keeps it here on Earth as heat, where it can melt
more ice, etc., etc.
Another major find published in December in Geophysical Research Letters shows a
big mistake in the Arctic sea ice melt. Satellites are not correctly reporting rotten multi-year ice. What was reported by the satellites as solid multi-year ice or thick
first year ice was in fact rotten multi-year ice, with low strength and as much
as 25%
open water in between flows. The paper says that the satellites see the two
similarly, but that is a little hard to understand and is obviously rooted in a
much more complicated understanding of how the satellite works. What the authors say is that even though we
have had a slight increase in summer sea ice extent for the last two years, giving
the overall impression that Arctic sea ice is recovering, the new results show
that the ice conditions in the Arctic are in fact still declining. The important
thing to understand about Aortic sea ice is how much multi-year ice is there.
the mulit-year ice does not melt in summer. It is the open water in the summer
time that contributes so highly to the feedback. The difference in reflectivity
between ice and open water is nine times. This is one of those unstoppable
things. It is unstoppable once it starts, barring some fantastic effort by the
people of this planet to reverse the warming trend to a point some amount cooler
than when Arctic Sea ice was stable. we can not just return conditions
back to the stability point because we have all of this extra heat that has been
added to the system that must be removed before stability can be regained.
Winnipeg Free Press
http://www.winnipegfreepress.com/local/arctic-ice-melt-alarms-scientists-83704042.html
Barber, D.
G., R. Galley, M. G. Aspin, R. De Abreu, K.-A. Warner, M. Pućko, M. Gupta, S.
Prinsenberg, and S. Julien (2009), Perennial pack ice in the southern Beaufort
Sea was not as it appeared in the summer of 2009, Geophys. Res. Lett.
February 5, 2010 Fred Pearce, The Guardian Puts
EmailGate to Rest I am just going
to quote Fred Pearce from the Guardian. "None of the 1,073 emails plus 3,587
files containing documents, raw data and computer code upsets the 200-year-old
science behind the "greenhouse effect" of gases like carbon dioxide, which traps
solar heat and warm the atmosphere. Nothing changes the fact that carbon dioxide
is accumulating in the atmosphere thanks to human emissions from burning
carbon-based fuels like coal and oil. Nor the calculations of physicists that
for every square meter of the earth's surface, 1.6 watts more energy now enters
the atmosphere than leaves it. And we know the world is warming as a result.
Thousands of thermometers in areas remote from any conceivable local urban
influences tell us that."
February 5, 2010 Academic Board of Inquiry Absolves
Dr. Michael Mann of any Wrong Doing in EmailGate Dr. Mann is the
U.S. connection to Emailgate, No crimes here. Will somebody stop the
Groundhog Day movie now? Dr. Mann is one of the senior world climate scientists
responsible for "The Hockey Stick" . He works at Penn State.
January 31, 2010 Do You Know How The
Climatologists Correct for the Urban Heat Island Error? Climate
models are made out of all of these cells. The are typically about 10 km on edge
(62 miles). Temperature analysis is done on a gridded basis. The scientists do
not use the obviously heat modified temperatures of urban weather stations
unadjusted. That would be unintelligent. The weather stations in each grid are
all averaged together to get a number for that grid, if there are none, or there
is a metropolitan area in a grid - the individual stations are evaluated and the
heat island effect is "adjusted" out of the warmer station.
January 30, 2010 Add Stratospheric Dryness to the
List of Reasons Why We H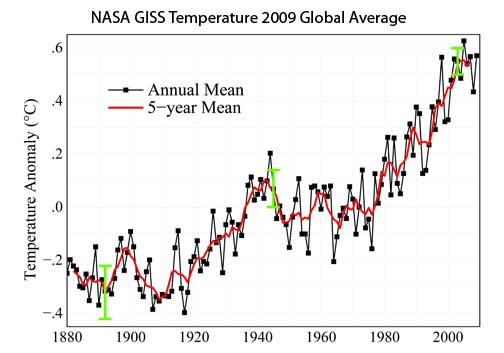 ave Not Set Year After Year of Hottest Ever Temperature
Records: It never ceases to amaze me - the tenacity
of the
dedicated
climate skeptics. Now they are leading a race
to see how many people they can convince that climate change is not real because
they say
we are not setting a global temperature records every single year. They do
not understand that the chaos of weather makes it extremely unlikely that this
will ever happen.
We can see how this chaos affects our global temperature from year to year by
looking at the GISS and UK Met Office Temperature records.
The UK Met's annual temperature graph is slightly
different form the GISS dataset (The U.S. Government Record from NASA).
The Met office calculates global average
temperature a shade different from GISS and consequently 1998 is the hottest year in
the UK Met record, whereas
2005 is the hottest
year in the GISS record. Neither GISS or the UK Met are wrong. Each
has a different way of calculating a global average temperature from global
records. But the skeptics will say otherwise. So, what really matters is the
trend. The
absolute temperature is not all that important, it is the trend that matters.
ave Not Set Year After Year of Hottest Ever Temperature
Records: It never ceases to amaze me - the tenacity
of the
dedicated
climate skeptics. Now they are leading a race
to see how many people they can convince that climate change is not real because
they say
we are not setting a global temperature records every single year. They do
not understand that the chaos of weather makes it extremely unlikely that this
will ever happen.
We can see how this chaos affects our global temperature from year to year by
looking at the GISS and UK Met Office Temperature records.
The UK Met's annual temperature graph is slightly
different form the GISS dataset (The U.S. Government Record from NASA).
The Met office calculates global average
temperature a shade different from GISS and consequently 1998 is the hottest year in
the UK Met record, whereas
2005 is the hottest
year in the GISS record. Neither GISS or the UK Met are wrong. Each
has a different way of calculating a global average temperature from global
records. But the skeptics will say otherwise. So, what really matters is the
trend. The
absolute temperature is not all that important, it is the trend that matters.
The GISS record shows that it has been
four years since we set the last high temperature record, before that it was
five years. After 1990 it was six years before a new high temperature record was
set. After the high in 1981 it was another six years.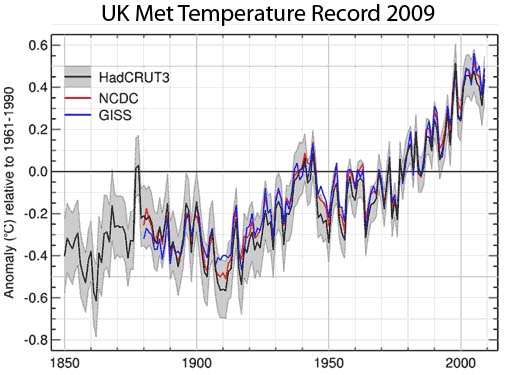 Then it was 37 years after
the high set in 1943 until another global high temperature record was set.
Earth's temperature has NOT cooled since the turn of the century. Remember
when the climate scientists said, back in the early 1980s, that it would be
twenty or thirty years before we new for sure if climate was changing or not?
Bingo! It's the chaos that prevents the short term assumption. Before
2009, 2005 was the hottest year ever, Before 2005, it was 1998, etc. the
trend is still upwards. This is simply chaos, or noise in the
data. It is completely normal and will continue to
happen like this into the future. Call me back about this one in twenty or
thirty years.
Then it was 37 years after
the high set in 1943 until another global high temperature record was set.
Earth's temperature has NOT cooled since the turn of the century. Remember
when the climate scientists said, back in the early 1980s, that it would be
twenty or thirty years before we new for sure if climate was changing or not?
Bingo! It's the chaos that prevents the short term assumption. Before
2009, 2005 was the hottest year ever, Before 2005, it was 1998, etc. the
trend is still upwards. This is simply chaos, or noise in the
data. It is completely normal and will continue to
happen like this into the future. Call me back about this one in twenty or
thirty years.
Solomon, et. al. Contributions of Stratospheric Water Vapor to Decadal
Changes in the Rate of Global Warming, Scinece, January 2010.
January 29, 2010 IPCC Wrong
Again: Methane is
Responsible for a Third More Warming than we Previously Understood:
This is about complex atmospheric chemistry. Our previously simple
understanding of the concentration of greenhouse gases in our atmosphere does
not do justice to the complex atmospheric chemistry that goes on 24/7. The
explanation is not so complex though. Methane reacts differently with different
things in the atmosphere at different times. These different reactions tell us
the strength of the greenhouse gas response. For example, the methane
decomposes after a dozen or so years, but the decomposition byproducts are CO2
and ozone, both greenhouse gases. The consequences are much more far reaching
and include water vapor, volatile organic compounds sulfur dioxide, carbon
monoxide, aerosols, etc. In the past our view was much more simple. We just
compared the methane straight to carbon dioxide to get a Global Warming
Potential (GWP) But it is not that simple. Methane was listed in the Fourth
Assessment report of the IPCC as having a GWP of 25. The new GWP is 34.
All told, methane is much more powerful of a greenhouse gas than we once
understood.
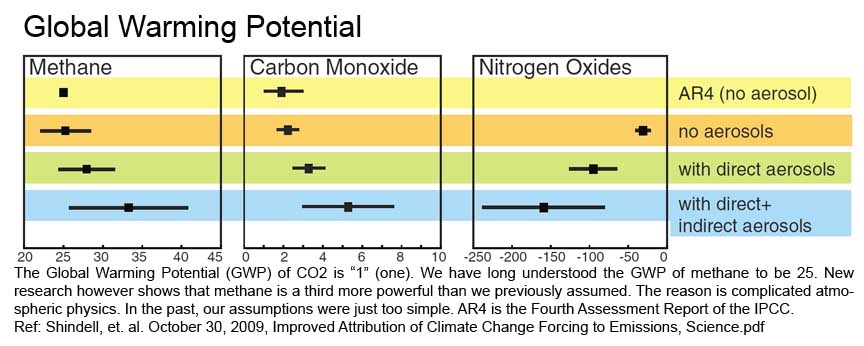
Shindell, et. al. October 30, 2009, Improved Attribution of Climate Change
Forcing to Emissions, Science
January 27, 2010 The scientists told us that the
weather would become more variable - Extreme winter weather blamed on global
warming: Well, they told us this would happen. Since the early
1980s. scientists have been saying that the weather would get more variable,
that storms would get worse in a warmer planet. A new report by the
National Wildlife Federation reports that this is just what is happening.
The last couple of winters have been peculiarly active. Warmer weather has
kept the great lakes open and increased lake-effect snow. A cold snap across the
south in Early April 2007 caused billions in agricultural damage because the
warmer than normal march preceding the cold snap had caused orchards to bud.
They were frozen by the cold snap. Warmer winters are responsible for the
massive never-before-seen beetle outbreak in the Rockies. Warm weather will make
normal snow belt areas experience more ice storms - which are immensely more
damaging.
Odd-ball Winter Weather: Global Warming’s Wake-Up Call for the Northern United
States, National Wildlife Federation, January 2010.
January 25, 2010 Pacific pH Rising Ocean Wide
http://seattletimes.nwsource.com/html/localnews/2010846811_ocean21m.html
January 24, 2010 The Rabid Radical Climate
Skeptics Will Stop at Nothing. They Have No Morals, Ethics or Scruples - Cat 4
and Cat 5 Hurricanes Will Nearly Double in Frequency on a Warmer Planet Says NOAA
The RRCS will not stop until they die. There is another statement in the IPCC
report that the RRCS have taken exception too. It concerns the increased
frequency of hurricanes on a warmer planet. I don't know the details, but I can
tell what likely happened. It was the same thing that happened with the
Glaciergate deal. The scientists know, they have an overwhelming amount of
circumstantial evidence, that there will be catastrophic melting of the
Himalayan glaciers by 2035. But it could not be proven according to peer review
principles. Remember, peer review is more stringent than a murder trial.
In a murder trial, the suspect can be convicted with circumstantial
evidence so long as the evidence shows that the murder was committed "beyond a
reasonable doubt". The definition of "beyond a reasonable doubt" is a
difficult one to come by, but in general it means " a moral certainty".
In a peer reviewed journal, facts are required. Reasonable doubt, circumstantial
evidence, moral certainties - none of these work. But the scientists
understand, they have enough circumstantial evidence to prove beyond a
reasonable doubt. there is a moral certainty - yet the rules of academia prevent
this certainty from being published as fact.
So in this latest rabid radical climate skeptic propaganda, the frequency of
stronger hurricanes caused by warming is in dispute. This has been an
exceedingly difficult question to answer in academia and reports written prior
to the 2007 IPCC report did not suggest that this frequency would increase -
even though circumstantial evidence was beyond a reasonable doubt that they
would. So the radical skeptics are making a big stink about it, like so many
other ways that they have been designing propaganda to destroy our planet in
their ignorance. So yesterday, a paper was published in Science that has
figured out how to model the problem. This paper proves that what the scientist
said about frequency and strength of hurricanes on a warmer planet was true,
only the statement was made before the "proof" was published. The
study by Bender et. al., says that the number of Cat
4 and Cat 5 hurricanes will increase approximately 81% on a warmer planet.
Bender, et.
al., Modeled Impact of anthropogenic warming on increased frequency of
hurricanes, Science, January 2010.
January 22, 2010 Climate Summary for 2009
In the U.S., 2009 was 0.3 degrees F above
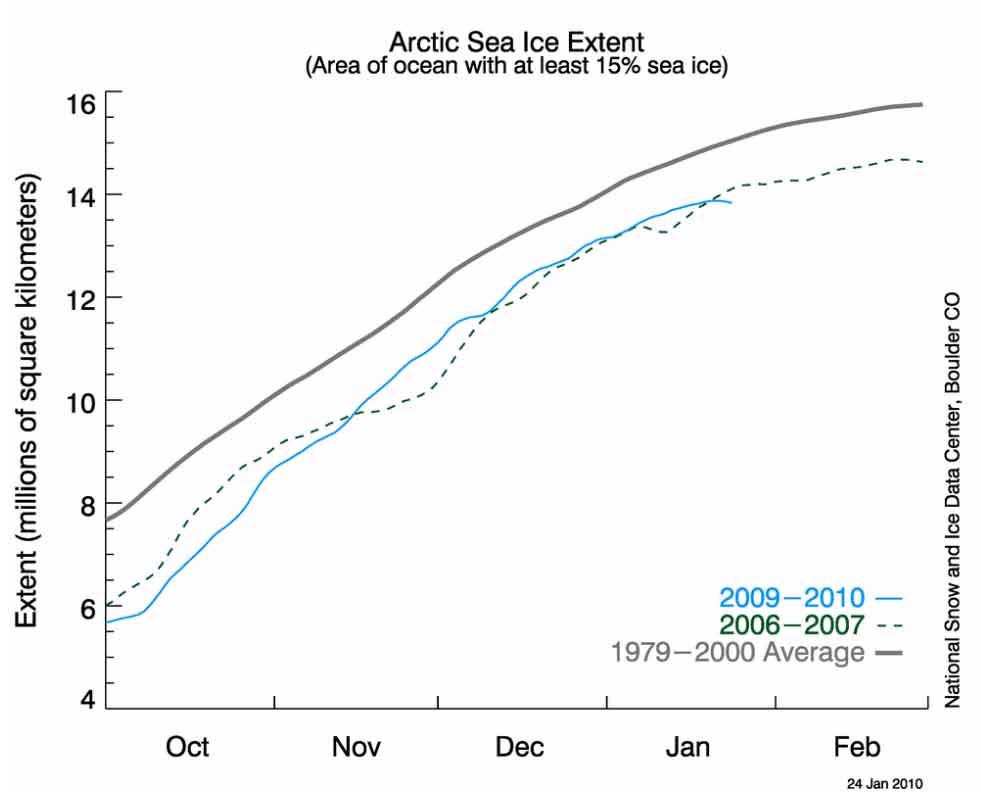 the
20th century average. The solar minimum continues. The two year lag from the
Pacific Decadal Oscillation continues. This is why it is not 1.3 degrees above
normal or more. I have attached a view of Arctic sea ice extents from the
National Snow and ice Data Center. This is an image not normally seen in the
middle of winter. But look where sea ice is right now. It is following almost
exactly along the record setting year 2006 - 2007, There was an article
that I looked at a few days ago, but didn't publish that said that there was
some questions about last years measurements. The paper came from a polar
scientists doing research in the Beaufort Sea up there north of Alaska.
The World temperature last year was the second warmest ever recorded. It was the
warmest year ever recorded in the southern hemisphere. The last ten years was
the hottest decade ever recorded.
the
20th century average. The solar minimum continues. The two year lag from the
Pacific Decadal Oscillation continues. This is why it is not 1.3 degrees above
normal or more. I have attached a view of Arctic sea ice extents from the
National Snow and ice Data Center. This is an image not normally seen in the
middle of winter. But look where sea ice is right now. It is following almost
exactly along the record setting year 2006 - 2007, There was an article
that I looked at a few days ago, but didn't publish that said that there was
some questions about last years measurements. The paper came from a polar
scientists doing research in the Beaufort Sea up there north of Alaska.
The World temperature last year was the second warmest ever recorded. It was the
warmest year ever recorded in the southern hemisphere. The last ten years was
the hottest decade ever recorded.
http://www.giss.nasa.gov/research/news/20100121/
January 21, 2010 Now it's Glaciergate - The
Inability of Scientists to Convey Their Knowledge of the Climate Crisis is
Almost as Astonishing as the Dangerous Climate Changes Taking Place Right Now -
And I Am Not Talking About a Simple Error In An Incredibly Vast Report.
Yes there was a mistake in the 2007 IPCC report, I am sure there were
more than one. The biggest mistake is that the report does not go far enough in
projecting future climate change. Virtually everything that the report has
projected has been proven to be conservative. There are even a number of things
that climate change has started to have impacts upon, that are not even
considered in the report. Things like feedback from dying forests and
accelerating undersea methane clathrate emissions. Not to
mention numerous things that happened between the time that the IPCC quit taking
papers ( in some cases as early as 2005), and the date of publishing in late
2007. So it is not likely that the glaciers of the Himalaya will melt by
2035, those in Glacier National Park will melt by then.
 The
claims that the 2035 date was off by 300 years are ludicrous. sure, it may be
300 years before every block of ice is melted, in the same light that it will be
2100 before Earth's temperature increases by 11.5 degrees. By the time it get's
11.5 degrees warmer - we will be toast. In 20 or 30 years, the glaciers
catastrophes from the current melt lakes bursting and flooding in unprecedented
ways will be passing and great famine from dwindling water supplies will be the
great threat. Who cares if there was one paragraph in the report that was worded
wrong. Millions will die, probably 10s of millions. Does this mean that Pauchuri
should resign? That's preposterous.
The
claims that the 2035 date was off by 300 years are ludicrous. sure, it may be
300 years before every block of ice is melted, in the same light that it will be
2100 before Earth's temperature increases by 11.5 degrees. By the time it get's
11.5 degrees warmer - we will be toast. In 20 or 30 years, the glaciers
catastrophes from the current melt lakes bursting and flooding in unprecedented
ways will be passing and great famine from dwindling water supplies will be the
great threat. Who cares if there was one paragraph in the report that was worded
wrong. Millions will die, probably 10s of millions. Does this mean that Pauchuri
should resign? That's preposterous.
The glaciers in the Himalayas are melting. Their melt has significantly
accelerated in the very recent past, and the results will very likely end in
huge catastrophes as these glacial melt lakes burst their frail moraine dams and
flood the countryside below. These melt lakes are forming by the hundreds.
They are forming very quickly and the risks are enormous. The will ese lakes are
very fragile and geologically unstable. A friend of mine actually just returned
from a filming trip to the Bhutan to investigate. His movie can be seen at the
Texas Spirit Theater of the Bob Bullock Museum. My friend is Pat Fries, Owner of
Arrowhead Films here in Austin. His film Silent Tsunami
can be seen
here.
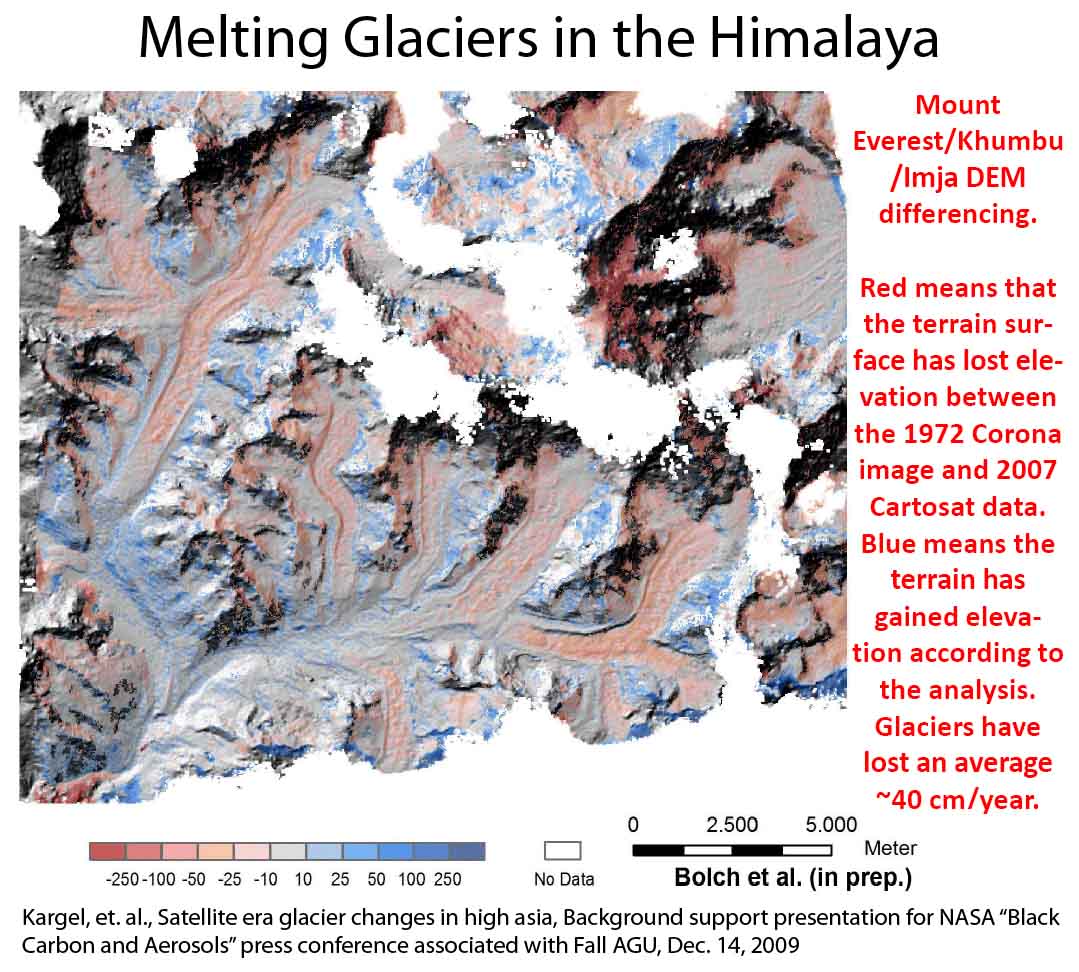
The image to the right is a satellite view of the area of the Himalayas around
Mount Everest. You can see Mount Everest in the
upper middle are of the image. The river-like looking structures are glaciers.
Red means that melt has occurred. The analysis says about 40 cm per year (16
inches) on average since 1972. Of course we know from other studies that this
rate has accelerated.
This image is from a backup material presentation given at a press conference by
NASA in December 2009. This presentation includes 46 pages of information about
the melting glaciers of the Himalaya. Like the rest of the world, there are some
glaciers that are not melting, or whose fronts are surging (one can not say that
these glaciers are not melting, but one can say, and this NASA presentation
makes this clear, that determining a timeline for Himalayan glacier melt is very
difficult given the state of knowledge today. The mass balance solution
for any individual glacier in this condition is very complicated. Glaciers
that are retreating as well as thinning though, are fairly easily identified as
"melting". This is the state of the vast majority of glaciers across the world,
and most of them are melting rapidly.
We are likely where we were in the analysis stage of the Himalayas as where we
were with Greenland twenty years ago. The estimates of melt are likely
conservative. Twenty years ago we understood that it could take thousands and
maybe even 10,000 years for Greenland to melt. Today we know that it could
likely happen in less than a thousand years and possibly even several hundreds
of years. A link for NASA presentation is given below.
Kargel, et. al., Satellite era glacier changes in High Asia, Background support
presentation for NASA “Black Carbon and Aerosols” press conference associated
with Fall AGU, Dec. 14, 2009.
January 10, 2010 CO2 Climate Sensitivity was Significantly Higher When
Climate was a Few Degrees Warmer This study from Yale, the
University of Hong Kong and U of C Santa Cruz looked at climate between 3 and 5
million years ago, the point in the past when temperatures were as close to
today as they have been since. Their goal was to find a stable warm
climate state and evaluate the equilibrium conditions for climate sensitivity.
You see, our climate today is far from equilibrium after 200 years of fossil
fuel carbon emissions. One of the reasons is the great heat content of our
oceans. For our planet to be in equilibrium, the oceans have to absorb the
excess CO2 in the atmosphere. Surface ocean waters can only absorb so much CO2,
but ocean currents allow for the surface waters to circulate to the deep ocean.
Deep waters have lost much of their CO2 load by the time they are circulated
back to the surface. This process takes about a thousand years and it is just
one of the slow feedback processes that helps our climate return to equilibrium
after some external 'force" pushes it "out" of equilibrium.
Normally the external forcing is one of the three solar cycles associated with
Earths orbit around the sun. But today, mankind's civilization is forcing our
climate with all of these extra greenhouse gases that we are putting into the
atmosphere. So on a 'normal" planet, when climate is in equilibrium, or when CO2
is about 40% less than it is today with the same average planetary temperature,
these scientists found a sensitivity to climate change that is somewhere between
40% again as much and twice what the current models show. That is, the
same forcing produces twice the warming.
Pagini et. al., High Earth-system climate system sensitivity from
Pliocene carbon dioxide concentrations, Nature Geoscience, January 2010.
January 9, 2010 Methane Releases from Arctic Ocean Higher than Ever
Recorded It's the Laptev Sea again. This is the part of
the Arctic Ocean t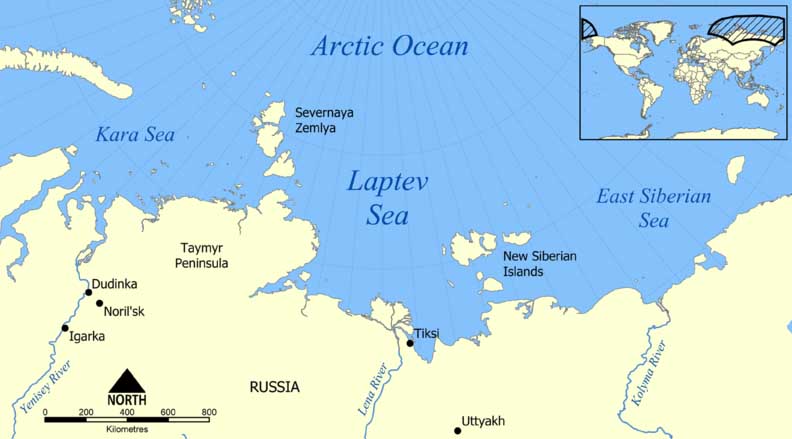 hat
is just north of Siberia (see
here). The springtime air temperature across the region in the period
2000-2007 was an average of 4C higher than during 1970-1999, likely the highest
temperature rise on the planet. The estimate of carbon locked up under the
Laptev and northern coast of Russia is up from last year to 1,600 gigatons.
The scientists are still not saying exactly how much methane is coming up from
the ocean floor, they just can't tell yet. But what we have seen is that
methane, which had stabilized in our atmosphere over about the last decade, is
rising again. the stabilization was attributed to better agriculture practices
across the world. (see here)
hat
is just north of Siberia (see
here). The springtime air temperature across the region in the period
2000-2007 was an average of 4C higher than during 1970-1999, likely the highest
temperature rise on the planet. The estimate of carbon locked up under the
Laptev and northern coast of Russia is up from last year to 1,600 gigatons.
The scientists are still not saying exactly how much methane is coming up from
the ocean floor, they just can't tell yet. But what we have seen is that
methane, which had stabilized in our atmosphere over about the last decade, is
rising again. the stabilization was attributed to better agriculture practices
across the world. (see here)
http://news.bbc.co.uk/2/hi/science/nature/8437703.stm
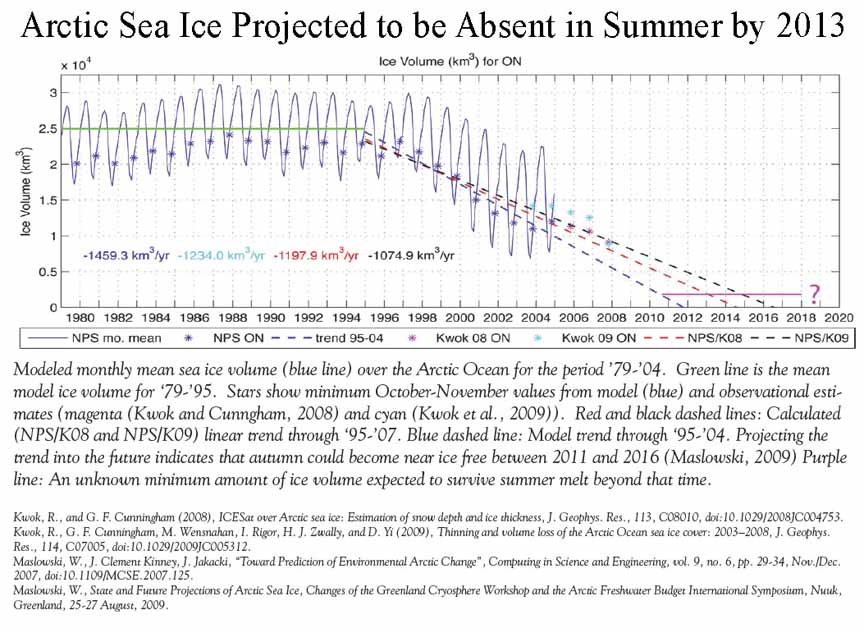
January 6, 2010 Arctic Sea ice may disappear by 2013
Arctic sea ice may disappear by 2013: Arctic sea ice is in trouble and the
implications of the global feedback caused by the lack of sea ice are extreme.
Open water absorbs eight times more heat than does ice. Ice reflects the heat
harmlessly back to space. Water keeps the heat to melt more ice and to add heat
to the atmosphere that then stays in the atmosphere because of the greenhouse
effect. Polar ice is the Earth’s air conditioner. The warming feedback caused by
melting polar ice, because of this unprecedented ice melt in the Arctic, is not
represented in the global climate models. This is happening 70 years ahead
of schedule (see
here).
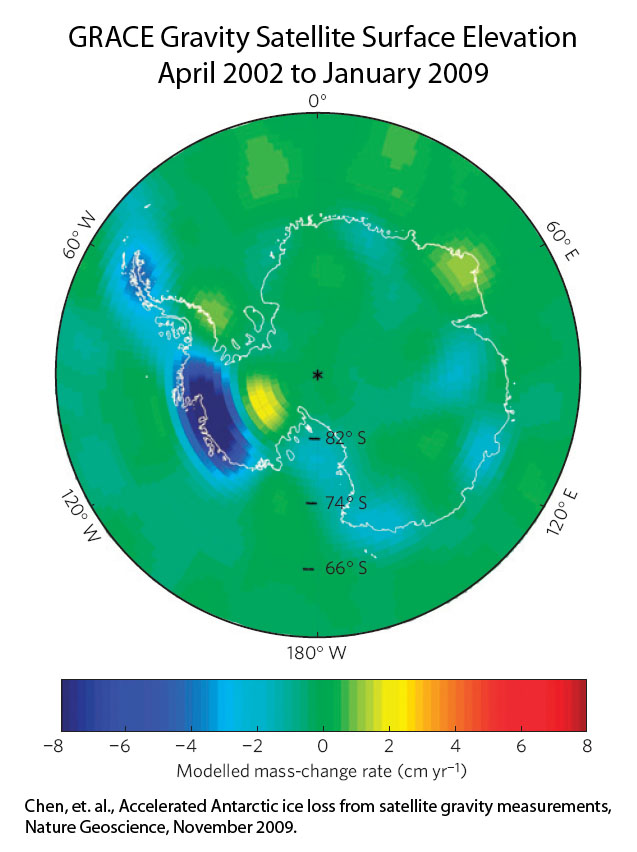
December 31, 2009 Antarctica melt / ice loss
accelerates Recent studies using the new GRACE gravity
measuring satellites (see here) have shown startling new results for ice melt /
ice loss from Antarctica. As the dataset from the new satellites, put up
in 2003, grows larger, the melt / ice loss continues to grow. Previous studies
have shown the melt/loss coming
 mainly
from West Antarctica, but this recent analysis of the satellite data shows that
in 2005/2006 east Antarctica's ice loss accelerated from near zero to 57
gigatons of ice per year. West Antarctica showed an acceleration of ice loss at
about this same time as well.
mainly
from West Antarctica, but this recent analysis of the satellite data shows that
in 2005/2006 east Antarctica's ice loss accelerated from near zero to 57
gigatons of ice per year. West Antarctica showed an acceleration of ice loss at
about this same time as well.
Overall ice loss from Antarctica is now 220 gigatons per year. Remember
too, The IPCC 2001 report said that Antarctica would experience no negative
volume changes (no ice loss greater than snowfall) for at least 100 years. The
2007 IPCC report actually reduced sea level rise from 2001 by about a foot to
22" max. They limited the contribution to sea level rise from melting ice sheets
to the rate observed from 1993 to 2003.
Accelerated Antarctic ice loss from satellite gravity measurements, J. L.
Chen, C. R. Wilson, D. Blankenship & B. D. Tapley, Nature Geoscience advance
online publication Published online: 22 November 2009, doi:10.1038/ngeo694
December 28, 2009 A Strong Bout of Natural Cooling in
2008 The authors make it clear that 2008 was a year that
reflected strong cooling across North America but not unusual in the least, at
least from a climatological standpoint. Many people out there, including
many weather people on television seem to think there is something special about
the relatively cold temperatures that we are having. What is special is that
planetary warming has lifted our climate out of its old normals. Across much of
the country it has been a decade since we have seen this kind of cold, but that
doesn't mean that before a decade ago, this type of weather wasn't normal,
because it was. The great concern of the authors of this paper was that climate skeptics are using the cooling to declare
that climate change is not real. The average contiguous U.S. temperature for
2008 was 0.2 degrees above the 1900 to 2000 average. Globally, 2008 tied
with 2001 for the eighth warmest year ever recorded. They repeatedly said that
2008 was completely within the natural variability of climate and that in a year
or two the U.S. would return to record heat.
The study looked at several models and actual conditions. What they found was
that La Nina and the Pacific Decadal Oscillation were responsible for the
cooling in North America (see here).
Of course we all knew this all along, but Perlwitz et. al., proved it with
models and statistics. The most amazing news however was that temperatures in
the Equatorial Pacific were actually the
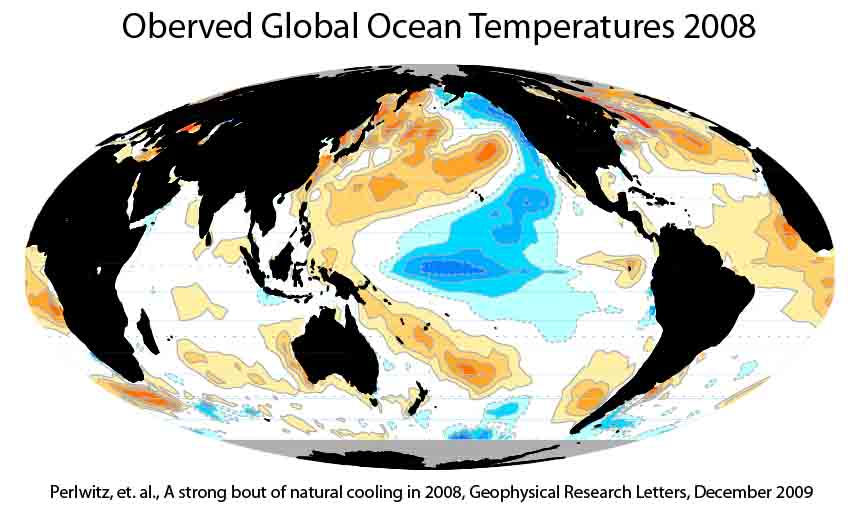 coldest
in the instrument record.. Here is a quote from the paper: "Our appraisal of the
natural SST conditions in the Nino 4 region, with anomalies of about 1.1 K
suggests a condition colder than any in the instrumental record since 1871. We
illustrated that North America would have experienced considerably colder
temperatures just due to the impact of such natural ocean variability alone, and
that the simultaneous presence of anthropogenic warming reduced the severity of
cooling."
coldest
in the instrument record.. Here is a quote from the paper: "Our appraisal of the
natural SST conditions in the Nino 4 region, with anomalies of about 1.1 K
suggests a condition colder than any in the instrumental record since 1871. We
illustrated that North America would have experienced considerably colder
temperatures just due to the impact of such natural ocean variability alone, and
that the simultaneous presence of anthropogenic warming reduced the severity of
cooling."
The authors complete their publication with this caution: "This, and similar
recent attribution studies of observed climate events [Stott et al., 2004;
Hoerling et al., 2007; Easterling and Wehner, 2009] are important in ensuring
that natural variability, when occurring, is not misunderstood to indicate that
climate change is either not happening or that it is happening more intensely
than the true human influence. In our diagnosis of 2008, the absence of North
American warming was shown not to be evidence for an absence of anthropogenic
forcing, but only that the impact of the latter was balanced by strong natural
cooling. Considering the nature of both the 2008 NA temperature anomalies and
the natural ocean variability that reflected a transitory interannual condition,
we can expect that the 2008 coolness is unlikely to be part of a prolonged
cooling trend in NA temperature in future years."
Perlwitz, et. al., A strong bout of natural cooling in 2008 Geophysical
Research Letters, December 2009.pdf
December 2009
Meehl, et. al., Relative increase of record high temperatures compared
to record low temperatures in the US, GEo Res Ltrs, December 2009.pdf
December 2009 Our Beaches Will be Gone Before My
Kid Graduates From College, and She is a Junior in High School Now
Remember those new, really fabulous gravity satellites called GRACE?
(For more about Grace see the essay Antarctic Paradox on
this site
http://www.meltonengineering.com/Mythbusters/Antarctic%20Paradox.pdf)
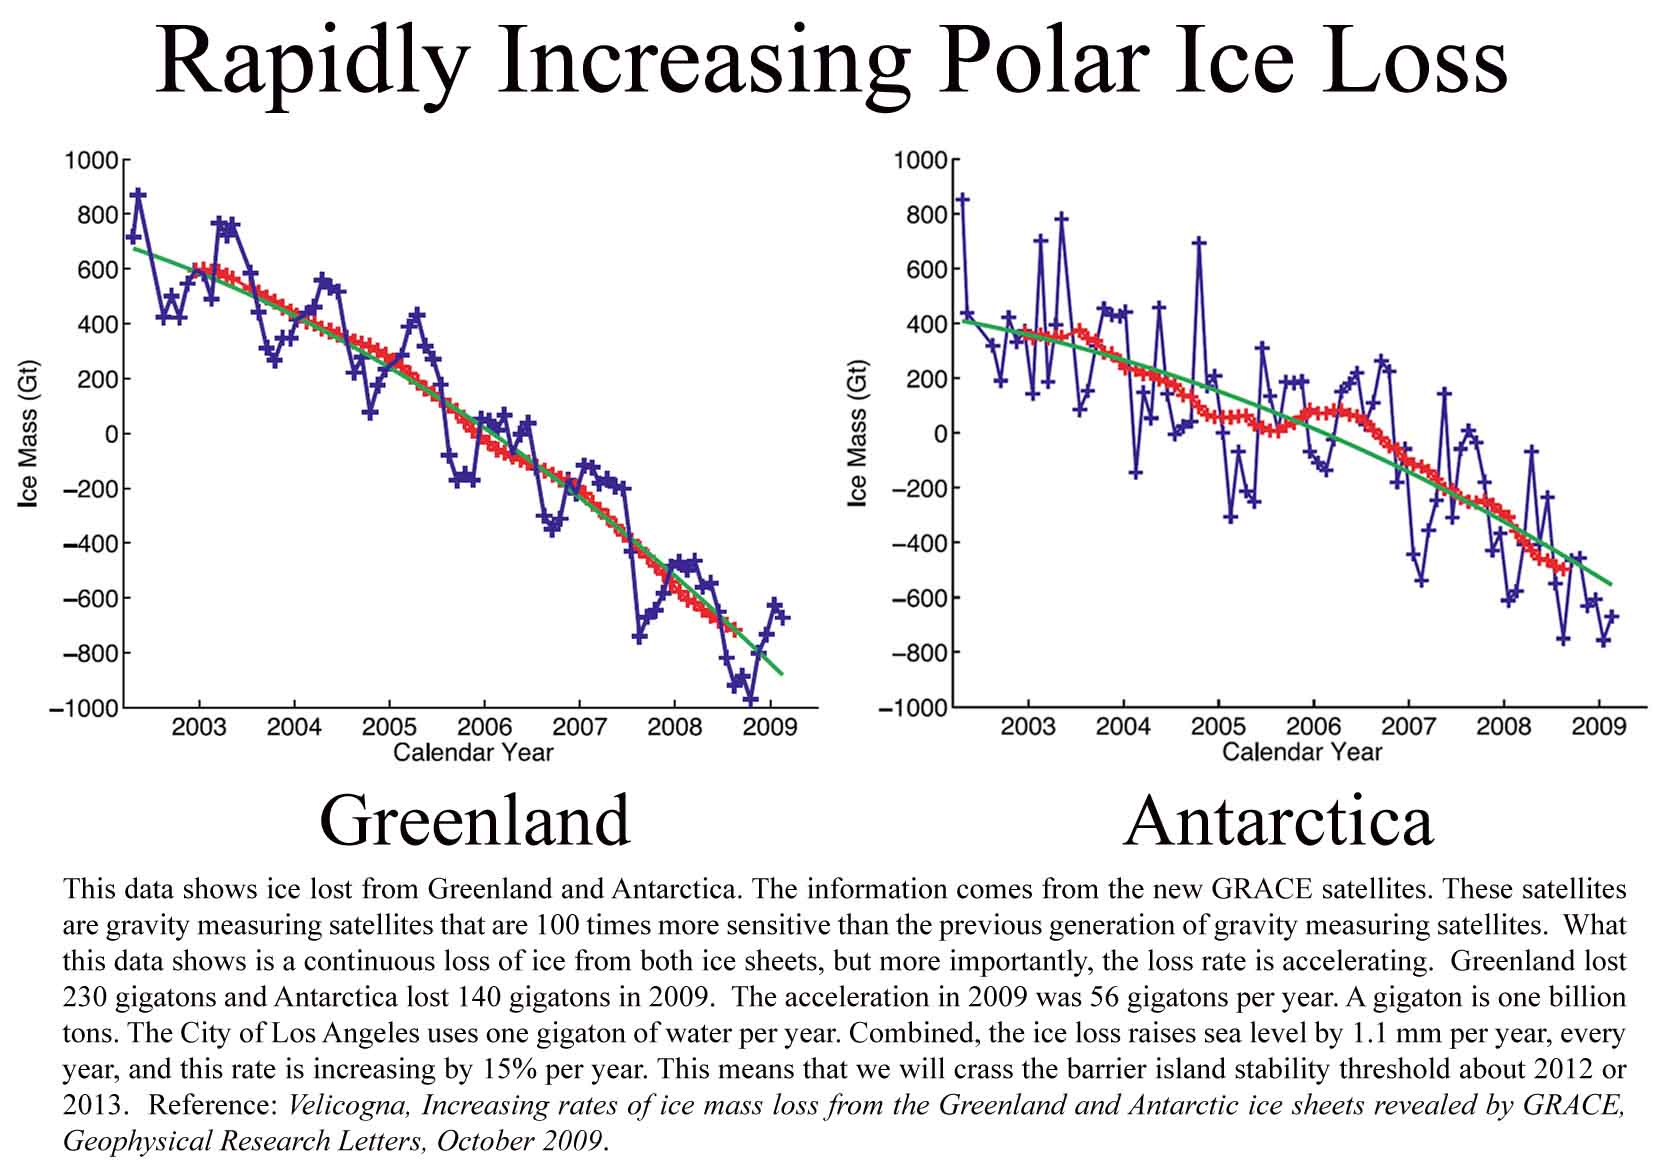
Velicogna, Increasing rates of ice mass loss from the Greenland and
Antarctic ice sheets revealed b y GRACE, Geophysical Research Letters, October
2009
December 2009
Tedesco, et. al., Pan arctic terrestrial snowmelt trends, 1979 to 2008,
from spaceborne passive microwave data
December 24, 2009 Ecosystem shift 0.26 km per year
1100 miles to central Wisconsin
1350 miles to Central Pensylvania
http://www.guardian.co.uk/environment/2009/dec/23/global-warming-spreading-quarter-mile-year
December 15, 2009 Sea level rise of 24 feet
on a planet two to three degrees warmer During the last
interglacial warm period, this study says temps were 2 to 3 degrees warmer.
There is considerable disagreement about this. James Hansen says a lot less.
Hmmm... Maybe we are already warmer than when sea level was 24 feet higher.
There are numerous different estimates of paleotemperatures, especially the last
interglacial. they mostly seem to focus on a degree or two warmer than today,
but Hansen's paper shows that we are warmer today. His comparison of South
Pacific Temperatures and Global temperatures is that they are sufficiently
similar to say that global temperatures follow South Pacific Temperatures.
Another fact that Hansen has brought to life is that mankind is changing
concentrations of CO2 in our atmosphere 20,000 times than at any time in the
last 65 million years.
What I think is that all of these temperature and sea level analyses are
correct. The problem is that CO2 levels are rising so fast that analyses are
more or less correct, just the timing is off a wee bit. Twenty thousand times
faster is astronomically fast relative to anything that has ever happened
before.
It appears to me that if one
averages all of the temperature interpretations from the last million years,
they all turn out to be about the same. So in Nature Geoscience, Siddall, et.
al., have looked at stranded beaches and coral reefs across the world and
correlated ice loss from ice sheets to gravity changes (Greenland ice extends
11,000 feet above sea level, Antarctica is 13,000). When the ice sheets melt,
they seriously affect the Earth's gravitational field. So much so that sea level
in the north Atlantic and the north central Pacific rises by up to three feet.
But overall, across the planet, there was a two out of three chance that we are
in for 25 feet of sea level rise, if this was a normal climate change. But
since CO2 concentrations are rising more rapidly than at any time in 65 million
years, and given that CO2 concentrations are as high as any time in the last 20
million years, we may be in for a bit more sea level rise is my guess. There is a pretty
good consensus that says that about 35 million years ago was when Antarctica
started building ice mass.
So since CO2 concentrations are rising faster than any time in the last 65
million years, would it make sense that sea level would rise a bit faster and or
a bit more than
it did 125,000 years ago when CO2 levels were changing quite normally? And since
the rate of change (65 m year ago) and the CO2 concentration (20 m years ago)
are a tad beyond the last 125,000 years, how far fetched is it that sea level
rise will be greater than it was 125,000 years ago?
Siddall,
et.al., Constraints on future sea level rise from past sea level rise, nature
Geoscience December 2009
Hansen, et. al., Global
temperature change, PNAS, September 2006.pdf
December 12, 2009 The Annual Climate Summary for
2009 The global average looks to be the fifth warmest
ever. The U.S. will likely come in 0.05 or so above average - even with all of
the "bitter" cold recently, and the "summer that wasn't". My trip to the
Rockies this summer showed me what the public's collective memory was - about
ten years. Everywhere I went in the Rockies (filming my pine beetle movie)
almost every single local I ran across thought that the last several years had
been the coldest and wettest ever. The reports of coldest and wettest in
memory were, to me, exaggerated. Fortunately, I was able to have the same
discussion with a few true old timers. They new the score. The last
several years, according to the old timers (and my memory) were maybe as cold
and wet as average ( I have been camping in the Rockies in summer for 36 years)
So, what this tells me is that in general, the public has a memory that is no
longer than about ten years. It has been the last ten years ( a few more) since
we have seen anything near normal temperatures. When we finally get normal
temps and precip (we may never see these normals again btw) everyone thinks it
is the coldest and wettest ever because their collective memories are only ten
years long.
December 11, 2009 Bad News?
It is all too common these days that climate change is referred to as
bad news. Why not? Climate change will be much worse than we were told in the
20th century. If we are lucky it will only be really bad. Everything in
science is pointing towards "worse than projected, faster and with greater
impacts..." Bad, very bad indeed. If it's only bad we will be lucky.
If you smoke all your life, you get cancer.
We have smoked CO2 for generations. the effects are that our Earth has cancer.
We have found out in time for treatment to be effective. This is good news -
extraordinarily good news. We can start treatment in time to possibly have an
effect, it may not be too late.
A colleague in an advocacy group I work with puts it this way: Aren't
alternative energy sources good things on their own, without even considering
CO2? When peak oil causes petroleum related costs to skyrocket, will it
not be a good thing that we have already constructed a new alternative energy
infrastructure? When gasoline become prohibitively expensive, even for the
wealthy, will it not be good that we have invented an entire new fleet of
automobiles that run on electricity?
What is bad about not emitting mercury into the atmosphere by burning coal?
What about the latest research into coal reserves that show that we only have a
couple of decades before peak coal, not a couple of centuries? Won't it be a
good thing to develop a new energy supply before the price of coal gets too high?
After all, it will take nearly a generation to do this. If peak coal
arrives as suddenly as peak oil, developing a new energy supply in time will
indeed be problematic. What if one considers the hundreds of thousands of deaths
each year that are related to the other air pollutants that come from burning
fossil fuels? What is so bad about developing a newer, cleaner energy supply
sooner?
The switch will have to be made sooner rather than later, and the longer we wait
the more difficult the transition will be - we have all tried to switch to a new
way of doing things at the last minute and I am fairly sure that most of us
would have rather have had more time to prepare...
December 6, 2009 Missed story of the Decade! CO2
unleashes 50% more warming than thought. Climate change could be 1 1/2
times worse than previously anticipated The long term warming will likely be about 50% greater
than thought. A new study that looks at climate sensitivity three million years
ago when CO2 was thought to be in equilibrium across the planet, polar ice was
significantly reduced, sea level higher etc.
The long term ramifications of man-caused climate change have really not been
looked at in much detail until now. Those studies that did, used the more
familiar short term techniques extended into the future. These techniques
poorly recreate the slow feedback processes. These slow feedback processes are
difficult to model, at least until now. New modeling techniques are what this
paper is all about. The new study takes a different
approach and comes up with about half again as much warming as earlier thought.
So what are the differences between fast and slow feedback processes? Fast
feedback processes, are those that are used in all climate models. CO2 and other
greenhouse gases are only responsible for a fraction of the warming. It's the
feedback processes that really heat us up. The water vapor feedback alone is
estimated to be twice that from just greenhouse gases. A little warming causes
more evaporation, which captures more infrared radiation causing more warming
and more evaporation, etc. Other "fast" feedback processes are the cloud
process, albedo from ice and snow and aerosols. Slow feedbacks take a er, long
time to happen. Vegetation changes and ice sheet changes, soil carbon changes
from desertification or aforestation are all slow feedback processes. When
a forest grows up in a tundra ecosystem because of a warming climate, it takes a
while. The forest soaks up more heat because winter snows can not easily cover
every single bit of vegetation like can happen with a tundra plain. The
extra heat then combines with factors from the albedo feedback to compound
warming and the vegetation and albedo feedback processes.
What does this mean for me and you? The authors of the paper are not saying, but
it will not just automatically get 50% hotter when our climate catches up to the
atmospheric CO2 concentration. The extra warming starts now.
Poster
Nature Geoscience Sequestration Special
http://www.nature.com/ngeo/journal/v2/n12/index.html
December 7, 2009 The Psychology of Climate Crisis
Denial Irrefutable and unequivocally are two very exact
words that have been used by the most authoritative bodies of science to qualify
the validity, current impacts and dangerous planetary risks associated with the
climate crisis. The debate over causation was over in the 20th Century. What
is the deal?
There have been an increasing number of publications discussing this most
extraordinary issue, and the pages of this journal of discovery have seen their
own share of suggestions about why the disbelief and contrarianism continue
under such a high degree of certainty as is shown in the climate science. Here
are some explanations that I have gathered from several publications:
-
Individual's are reluctant to give up their comfortable
lifestyles. We don't want to travel less, do less, eat less, or by any
means, consume less.
-
Every day we see up to a couple of hundred advertisement
and are possibly exposed to several thousand. The great majority of these
advertisements, possibly over a million per year, tell us that we can have a
better life through consuming their product. How are we supposed to reduce
with pressure like this?
-
It is human nature to block or shut out terrifying
information. Those of us who have not known a cancer victim that has
been in complete denial are either lucky or really young.
-
Everyone else is in denial.
-
Climate change is a great way to practice
procrastination.
-
Blame China or India.
-
Conclude that one person is no match for the "global
solution".
-
Almost everyone is not being affected, and has never been
affected by climate change.
-
The supposed coldest and wettest periods in history
having occurred in some areas recently means that global warming is not real
- how could it be?
-
How can we know what the future will bring? We have
never, ever known what the future holds for us. This is possibly the biggest
counter-intuitive climate science issue there is.
-
Our society has never experienced climate change before,
we do not know how to behave. We do not understand a climate that is
different from the one we know.
-
Unstoppable and irreversible are descriptors that have
only been used for weather events in the past. Our society knows that
weather events may be deadly, but will not impact the globe, or for that
matter really that many individuals.
-
Climate change is associated with the only thing that the
public knows about climate - the weather. Very few understand the difference
between weather and climate.
-
Weather Persons, TV weather personalities, etc. are
vastly different from climate scientists. Climate concerns time periods
longer than thirty years, Weather concerns time periods less than 14 days.
-
Other authority figures, like the Bush Administration
have an enormous impact on public thinking, not to mention the false
authority of negative propaganda put out by moneyed interests.
-
Religion is possibly the biggest reason for denial. More
than half of Americans have Creationsists' beliefs. How can an individual
believe that the Earth is only 10,000 years old and at the same time
understand hundreds of thousands of years of climate data from ice cores, or
millions of years of climate data from sediment?
-
Climate scientists, like all scientists are conservative.
The language that they use generally doesn't mean what the non
scientists public understands these words to mean. Scientists rarely use
definitive verbs, because even when something is 99.7% likely, it is still
not an absolute certainty. Definitive verbs imply absolute certainty. A
scientists' ethics prevent him or her from imply absolute certainty unless
the event in question is 100% certain.
-
 The
outright lies: A common one is that warming has plateaued in the last
decade. This could not be further from the truth. Global temperatures
have plateaued, or even peaked, in 2006, not 2000. The global temperature
chart on the right shows no plateau, and unless one is blind to the annual
variability, or chaos in the record, one would be hard pressed to say that
our global temperature has even peaked, much less plateaued. What happened
between 1940 and 1980 was a plateau. It happened because of particulate
pollution form rapid industrialization without pollution controls. When
pollution controls went into effect in the late 1970s, the problem was
rapidly corrected.
The
outright lies: A common one is that warming has plateaued in the last
decade. This could not be further from the truth. Global temperatures
have plateaued, or even peaked, in 2006, not 2000. The global temperature
chart on the right shows no plateau, and unless one is blind to the annual
variability, or chaos in the record, one would be hard pressed to say that
our global temperature has even peaked, much less plateaued. What happened
between 1940 and 1980 was a plateau. It happened because of particulate
pollution form rapid industrialization without pollution controls. When
pollution controls went into effect in the late 1970s, the problem was
rapidly corrected.
-
There is another downright contrarian lie that the media
is perpetrating now that is particularly telling of the gall of the
perpetrators. The lie is that climate scientists are having a
particularly hard time explaining "why" our climate has plateaued.
Well, dangit, our climate has not plateaued, and the scientists have an
excellent explanation of why the last few years have not continued on to set
new record high global temperatures. So this is a double lie. The reason(s)
that our global average temperature has not gone on to set continued
records is ENSO, the PDO and the 22-year Sunspot Cycle (see
here).
-
The ADD American public: Television, conspicuous
consumption and instant gratification have created an Attention Deficit
Disordered public. Science is not an easy read, climate science is even
worse than most sciences. Climate scientists are not unlike other scientists
either, they are not educators or entertainers. Consequently, there is
little public patience. Or is just plain irresponsibility?
-
The psychology that I am most concerned about however is
that of compassion, responsibility, ethics and morals. I know it is
widespread, but I am afraid it is even more widespread than I fear. People
just do not care. If it is not affecting them here and now, for whatever
justifications are handy at the movement, they don't care.
Anthony Grayling , a philosophy professor at the University of
London.
Tim Kasser, a professor of psychology at Knox
University in Galesburg, Illinois.
Jean-Pierre Dupuy, professor of social philosophy at
the Ecole Polytechnique in Paris.
Scientific American, November 30, 2009
http://www.independent.co.uk/environment/id-rather-not-know-the-psychology-of-climate-denial-1834890.html
December 6, 2009 Thanks to the
Radical Climate Skeptics
The latest Pew Center poll shows an extraordinary change in public
understanding. It's like two decades of climate science has been flushed
down the toilet. All of a sudden, 14% of Americans have decided that what
they understood last spring is now hooey. Those in the U.S. who choose not to
believe in science are virtually in a dead heat with those who understand the
climate crisis.
I find this a little hard to believe, It must just be that Letterman attracts a
very progressive audience. Every time Dave makes a point about climate
change he gets a resounding positive reaction from the audience. Not a reaction
from a third of the audience - a resounding reaction. So how is this poll
valid?
It's valid because what I said about Letterman's audiences is likely very true.
The vast majority of Americans would never get close to the Ed Sullivan theater.
It is likely that the audience is skewed towards the progressives.
Unfortunately.
America is being fooled by the contrarian propaganda - for too many reasons to
count in anything short of four chapters. The results, as you have seen from the
recent scientific findings highlighted in this journal of discovery, will
only make mitigating the climate crisis even more profoundly difficult.
The forest of our planet are showing frightening symptoms of a changing climate.
And what the scientists are not telling us that when our climate warms by ten
degrees, most forests will not survive, and most will not grow back in any form
that is anywhere similar to what was there before. The warming in the mountains
will be greater and the forests of the Rocky
Mountains will likely disappear altogether. At least they will not survive in
the timeframes that are given. It takes centuries for ecosystems to shift
without trouble.
100 degree days in Texas will increase by five times. Summer heat across
much of Texas will 30% more extreme than the Sonoran desert. No trees grow
in the Sonoran desert, the trees of Texas will die a frightful death.
Minnesota and New York State will have extreme summer heat similar to what
happens in Texas today. The forests in Minnesota and New York State will not
survive the Texas Heat.
Fifty two million acres of trees are dead in North America because of climate
change enhanced insect infestation. This is somewhere between 21 billion and 26
billion trees. Last year alone, 8 billion trees died (18 million acres). The
previous record breaking insect infestation was 3 million acres and it took the
beetles ten years to kill that many trees. The scientists say there is not
reason for the infestation to stop as it takes extremely cold weather to kill
the bugs - cold like we have not seen in more than a decade and like we may
never see again.
The number of animals that have died because of this infestation is at least
equal to the the 21 billion to 26 billion trees that have been killed. The
forest of our planet will become carbon sources instead of carbon sinks. A solid
one-third of the CO2 on this plate is naturally sequestered by trees. The
airborne fraction of CO2 that causes warming will increase by an amount equal to
the emissions from over 2 billion people.
The USGS says our barrier islands and coastal wetlands will begin permanently
disappearing when sea level rise reaches 7 mm per year. At the current rate it
is rising, it will reach 7 mm per year somewhere between 2015 and 2020. Between
2004 and 2006 alone sea level rise increased from 3.3 mm to 3.7 mm per year.
This a 6% annual increase.
There are 405 barrier islands on the Atlantic and Gulf Coasts of the US totaling
over 3,000 miles in length. There are 5.3 million acres of coastal wetlands. The
USGS does not know how long it will take sea level rise to destroy the barrier
islands and wetlands, but given the high risk from hurricanes, once the destruction begins, it will likely not
take long for it to be complete. The loss of life in these massive
ecosystems will be uncountable.
The risk to you and me from just these few globally important climate events is
extreme beyond ex more of America that the hard won scientific findings are hooey.
I fear I must return to debunking the same moldy contrarian myths. There is
little enough time.
Pew Center Report
December 5, 2009 The Great Climate Change Hoax and Email Theft and Fraud
Prime Minister Brown is quite upset at the hysteria being caused by the
theft and fraud committed and being committed by and because of the East Anglia
University email theft and ensuing fraud. Here is his quote on the subject from
the Guardian on the 4th: "With only days to go before Copenhagen we mustn't be
distracted by the behind-the-times, anti-science, flat-earth climate skeptics…
We know the science. We know what we must do. We must now act and close the
5bn-tonne gap. That will seal the deal." (This is quite a colorful
statement to have come from Prime Minister Brown…)
I continue to see this one quote in the media hype about the email theft and
fraud. It talks about the "trick" that Michael Mann used to demonstrate
the temperature relationship that he is famous for in the climate science world.
I am an engineer most of the time, at least in the past, and us engineers have
lots of “tricks” that we use in our professional work. These "tricks" are
nothing more than interesting and effective ways to reveal information
They have nothing to do with deceit or treachery, they are simply novel ways of
doing something.
I new that this was what was being referred to in the media hype and was
immediately appalled at the deceit of, not only the perpetrators of this
illegally inspired negative propaganda, but of the guile of the media to honor
the accusation with ink and air time. Worse, in the several dozen popular media
pieces I have read since the theft, I have never seen a single explanation of
what the "trick" was. The media once again, through appalling ignorance
and what appears to be premeditated sensationalism, has helped to perpetrate the
Great Climate Change Hoax in their frighteningly broad show of ignorance of
basic investigative journalism.
The game these contrarians are playing with science is astonishingly dangerous.
The lack of basic investigational skills portrayed by virtually the entire media
industry is nothing short of journalistic manslaughter.
What Dr. Mann did was to leave out a portion of the data that he used from one
data source (numerous data sources were used in his temperature analysis). The
reason that he did not use this data was because, in a later publication, the
scientists responsible for publishing the original data recommended that the
data in question not be used in any future analysis. It is not uncommon for a
dataset to be revised in this manner. To use the data – after the data’s
responsible authors had said that the data should not be used, would be
completely irresponsible on the part of Dr. Mann. Because of the lack of
investigational skills of the media, the fraud being perpetrated by the climate
contrarian froth and fervor, remains unchecked.
The following is a detailed academic explanation of the "trick" that Mike made
(Dr. Michael Mann, director of Earth Sciences at Penn State). I lifted this
paragraph from Real Climate and their first post about the email theft.
"No doubt, instances of cherry-picked and poorly-worded “gotcha” phrases
will be pulled out of context. One example is worth mentioning quickly. Phil
Jones in discussing the presentation of temperature reconstructions stated that
“I’ve just completed Mike’s Nature trick of adding in the real temps to each
series for the last 20 years (ie from 1981 onwards) and from 1961 for Keith’s to
hide the decline.” The paper in question is the Mann, Bradley and Hughes (1998)
Nature paper on the original multiproxy temperature reconstruction, and the
‘trick’ is just to plot the instrumental records along with reconstruction so
that the context of the recent warming is clear. Scientists often use the term
“trick” to refer to a “a good way to deal with a problem”, rather than something
that is “secret”, and so there is nothing problematic in this at all. As for the
‘decline’, it is well known that Keith Briffa’s maximum latewood tree ring
density proxy diverges from the temperature records after 1960 (this is more
commonly known as the “divergence problem”–see e.g. the recent discussion in
this paper) and has been discussed in the literature since Briffa et al in
Nature in 1998 (Nature, 391, 678-682). Those authors have always recommend not
using the post 1960 part of their reconstruction, and so while ‘hiding’ is
probably a poor choice of words (since it is ‘hidden’ in plain sight), not using
the data in the plot is completely appropriate, as is further research to
understand why this happens.
December 2, 2009 Antarctic Melt Increases While
the Ozone Hole Keeps it Cool
What was once widely regarded as being stable for at least the next century has
already started to melt and at the least will contribute 4.5 feet to the IPCC
sea level rise prediction. The 22 inches from the IPCC and additional
melting identified as coming from Greenland put us up in the ten foot zone
now (here and
here). And these sea level rise guys always, and I mean always
say "at the minimum". The sea level rise scientists are some of the most
conservative of the climate scientists that I have read. This is an immense
report that summarizes the last decade's research on
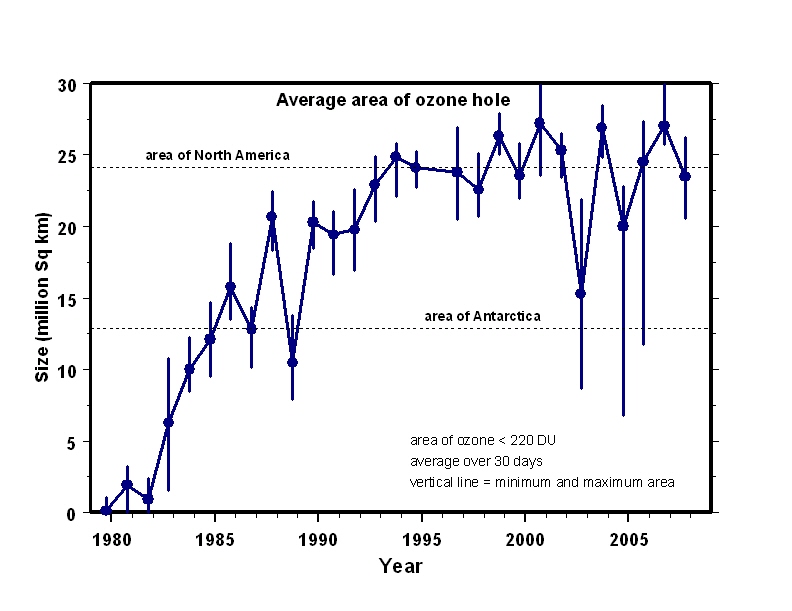 Antarctica. One of
the new findings they highlight is a new analysis of why temperatures have
remained relatively the same in Antarctica while the rest of the planet sees
continued warming.
Antarctica. One of
the new findings they highlight is a new analysis of why temperatures have
remained relatively the same in Antarctica while the rest of the planet sees
continued warming.
And by the way, the reason why Antarctic has started melting 100 years ahead of
schedule, when temperatures have only slightly warmed and remain far below
freezing across the vast majority of the continent - is a warming
ocean. Much of the ice in Antarctica comes in direct contact with the Great
Southern Ocean along the margins of the great ice sheet, and this is where much
of the melt is taking place. The ocean is warming, but more than that, ocean
currents in the far south are changing, bringing even warmer water into contact
with some areas of Antarctica.
The reason why Antarctica has escaped much of the warming that has happened
across the rest of the planet is the ozone hole. There are numerous reports that
show that the Montreal Protocol is working, that we are gaining control over our
stratospheric ozone depletion problem. But the Antarctic ozone hole remains.
The chart on the right shows thirty years of ozone holes, beginning when there
was no ozone hole. What happened is an abrupt environmental change occurred,
much like what is happening with greenhouse gases now. Our Earth's environment
can take only so much abuse, then, like any environment pushed to the edge, it
leaps to a new equilibrium.
Mankind almost lost the ozone
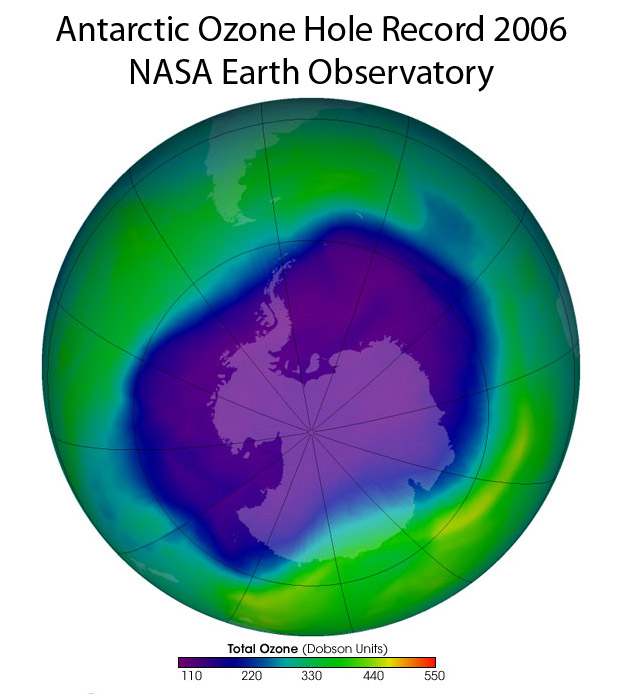 layer,
the consequences of which would have been catastrophic for the planet. At the
time, scientists were reporting a gradual 50% decline in stratospheric ozone
over the next hundred or more years if nothing was done to stop ozone depletion.
But an ugly surprise popped up in the mid 80s. An unexpected runaway chemical
reaction in the atmosphere ( a positive feedback...) created a massive ozone depletion zone over
Antarctica. By 1987 the inhabitants of this planet had come to understand the
grave danger and the Montreal Protocol was drafted, regulating ozone depleting
substances.
layer,
the consequences of which would have been catastrophic for the planet. At the
time, scientists were reporting a gradual 50% decline in stratospheric ozone
over the next hundred or more years if nothing was done to stop ozone depletion.
But an ugly surprise popped up in the mid 80s. An unexpected runaway chemical
reaction in the atmosphere ( a positive feedback...) created a massive ozone depletion zone over
Antarctica. By 1987 the inhabitants of this planet had come to understand the
grave danger and the Montreal Protocol was drafted, regulating ozone depleting
substances.
Twenty two years later the ozone hole is as big as ever. There are many signs
that ozone depleting chemicals are under control, yet the hole remains. The NASA
image on the right shows the record largest hole from 2006.
Why is this happening? It is a process that has been anticipated in the
climate models at some point in the distant future. The way the ozone hole forms
is that these crazy nitric acid clouds (natural) form in the ultra cold
Antarctic winter at elevations way, way above any clouds found on the planet.
The nitric acid combines with ozone depleting chemicals and when the sun returns
in the spring, ultraviolet light triggers a chain reaction that zaps the extra
oxygen off of the ozone molecule turning it into plain old oxygen.
The nitric acid clouds, called necreotic clouds, are natural, and have been
around since time began, but these man-made ozone depleting chemicals have not
been around - they are entirely foreign to our natural world.
What the climate models say about the future of stratospheric ozone is that
global warming will cool the stratosphere - this is already happening. the
blanket of greenhouse gases does not allow as much heat from the earth to
radiate back into space where some can be trapped in the stratosphere, so the
stratosphere gets cooler, even as the lower atmosphere (the troposphere) gets
warmer. The necreotic clouds can only form at the very coldest part of the
Antarctic winter. One of the things that makes polar winters so cold is the
atmosphere is thinner over the poles. In the winter, the cold air at the surface
of the poles contracts and allows the atmosphere to thin even more. This means
that the stratosphere gets closer to the surface. This allows a greater mixing
between the lower stratosphere and the upper troposphere, that makes it even
colder in the upper atmosphere of the polar regions. Which means more nitric
acid clouds, and more ozone depleting chemical reactions with any of the other
ozone depleting chemicals, doesn't matter.
But recent papers have shown the Montreal protocol is a success and
stratospheric ozone depleting chemicals are declining. It is the natural
nitrous oxide ozone depleting reaction that is keeping ozone levels low.
The man-made chemicals are on the wane, but ozone depletion because of nitrous
oxide is increasing. Nitrous oxide is a greenhouse gas that, because of
man, has increased 16% since the industrial revolution. It is a product mainly
of agriculture, and it is the third most important greenhouse gas after CO2 and
methane.
So, once again, our climate is ahead of the computer models, climate change is
happening faster, or the computers are too conservative or both.
Antarctic Climate
Change and the Environment (555 pages)
November 26, 2009 Airborne Fraction of CO2 Concentration vs.
Load The Airborne Faction Discussion: This topic is
controversial only in the minds of radical climate skeptics. Actually there is
controversy, but it is totally different from what the radical climate skeptics
(RCS) is saying. What RCS propaganda says is that because the airborne fraction
is not increasing, there is no basis for climate change. What the scientists are
talking about is completely different. The scientists are talking about the
"fraction" of CO2 in the sky relative to everything else is staying the same.
The RCS are saying that CO2 is not increasing and there for there is no basis
for global warming - a totally irrelevant statement compared to the topic and
investigation of this study. The RCS does not understand what "airborne
fraction" means.
Let me splain Lucy:
Pre- industrial atmosphere had 10 bazillion units of atmosphere and 3 bazillion
units of CO2 = 3% airborne fraction.
Today's atmosphere has 103.3 bazillion units of atmosphere and 4 bazillion units
of CO2 = 3% airborne fraction. EXCEPT - there's more stuff in the atmosphere,
there is more CO2 there, approximately 38% more than preindustrial times -
greater density. The atmosphere is thicker. There is more CO2 here to warm the
planet. The greenhouse affect is not controlled by the airborne fraction, it is
controlled by the amount of greenhouse gases present.
The RCS is confusing CO2 ratio with CO2 load. It is a very common
misunderstanding that I have to deal with all of the time in water quality
discussions. So because the public doesn't know jack, they get fooled. It
certainly "looks like" the scientists are saysing that there is no basis for
climate change. I think that the RCS is intentionally misleading in order to
further their agenda - or they are just plain old stupid, irresponsible and
unethical for not understanding the propaganda that they are distributing.
Folks tend to try and relate concentration with load all the time, but there is
a huge difference. The airborne fraction doesn't really mean anything by itself.
It is used to define other things.
The study suggests that something is absorbing more CO2 than expected, the
researchers know not what. It could be little green men from space. There is a
significant unknown factor in natural sequestration that is +/- 20% of the total
load (natural and anthropogenic combined - nature is not picky). These guys see
40% remaining in the atmosphere. That is the bottom end of hte discussion, the
high end, that I have seen is 64% stays in the atmosphere. And BTW - This is a
really, really good thing for us because it keeps the atmospheric load of CO2
from increasing even more rapidly.
This group of studies is one that looks at the atmosphere. There are other
studies that also look at the atmosphere that say the airborne fraction IS
increasing, which means that the sinks ARE slowing. But the most telling part
of the new discoveries is that the studies that look specifically at the sink
are seeing that they ARE slowing. This is a disconnect between scientists - one
the the RCS likes to mention so disdainly. Actually it's a disconnect between
about how the public understands science. These papers are very specific and
don't explain inter-relatedness very well. Other studies are just as certain
about the facts, very robust and up-to-date facts about CO2 sinks decreasing in
their capacity to absorb, they are just as correct as this paper (see
below). What this paper does not do, and never intended to do was to say
why the airborne fraction is staying the
same even though emissions are different. It very specifically analyzed the
question "Is the fraction constant or changing?".
Those other papers that say it isn't? Well now you have to understand how the
scientists measure how much of anything is in the sky. It's a big guess. We
aren't smart enough yet to weigh the atmosphere. We do have records of how much
fossil fuel has been burned, how much of our forests have been turned into CO2,
how much CO2 has been emitted to the atmosphere from agricultural practices and
loss of C from soils, etc. but we can't weigh the atmosphere (very well).What is
happening is that the atmospheric scientists are tying down the portion of the
fraction that goes to different places better with the help of the scientists
who are studying the specific sinks. Exactly how much will still be an estimate
until we can weigh the sky, or weigh theCO2 lost be farming practices, or weigh
the oceans to see how much carbon they have absorbed, etc.
Knorr, Is
airborne fraction of anthropogenic CO2 emissions increasing, Geophysical
Research Letters, November 2009.pdf
November 25, 2009 Oceans are Absorbing Three times less CO2 than 20
Years Ago This is some serious news. The study revised
work that was done 20 years ago that showed the lag between atmospheric CO2
concentrations and global temperature. The previous study showed that there was
a five month lag between CO2 concentrations and temperature. This new study has
concluded that this lag has tripled from five months to fifteen months. What
this means is that the oceans are absorbing CO2 three times more slowly today
than they did twenty years ago.
AA quote from Physorg.com's interview with the author, Jeffrey Park at Yale
University, is revealing.
"No one had updated the analysis from 20 years ago," Park said. "I expected
to find some change in the lag time, but the shift was surprisingly large. This
is a big change.
The reasons why this change has occurred are still a bit unclear, but a warmer
ocean definitely creates an ocean that has less capacity to absorb CO2, and our
oceans today are at all time record temperatures
(here). But it is likely that this
is not the only reason. Changes in what the author calls "ocean dynamics" which
are basically the way water circulates in the oceans are also implicated.
The dynamics in this case are the circulation that takes surface waters with
more CO2 and sinks them, so that they are replaced by deeper water that
has lost some of its CO2 load due to normal ocean carbon sequestration
processes. When this circulation slows, the ability of the ocean to absorb
CO2 slows because water with less CO2 in it can absorb more CO2 faster than if
it is saturated or near saturation.
Another quote from the Physorg.com interview give us a stark warning of what has
only previously been projected to happen in the future:
"Researchers have used climate models that suggest the oceans have been
absorbing less CO2, but this is the first study to quantify the change directly
using observations," Park said. "It strengthens the projection that the oceans
will not absorb as much of our future CO2 emissions, and that the pace of future
climate change will quicken."
Park, A
re-evaluation of the coherence between global-average atmospheric CO2 and
temperatures at interannual time scales, Geophysical Research Letters, November
2009
November 21, 2009 US Government
OMG Climate Report - - - Extreme Beyond Imagining - - - The U.S. Global Change Research Program (USGCRP) coordi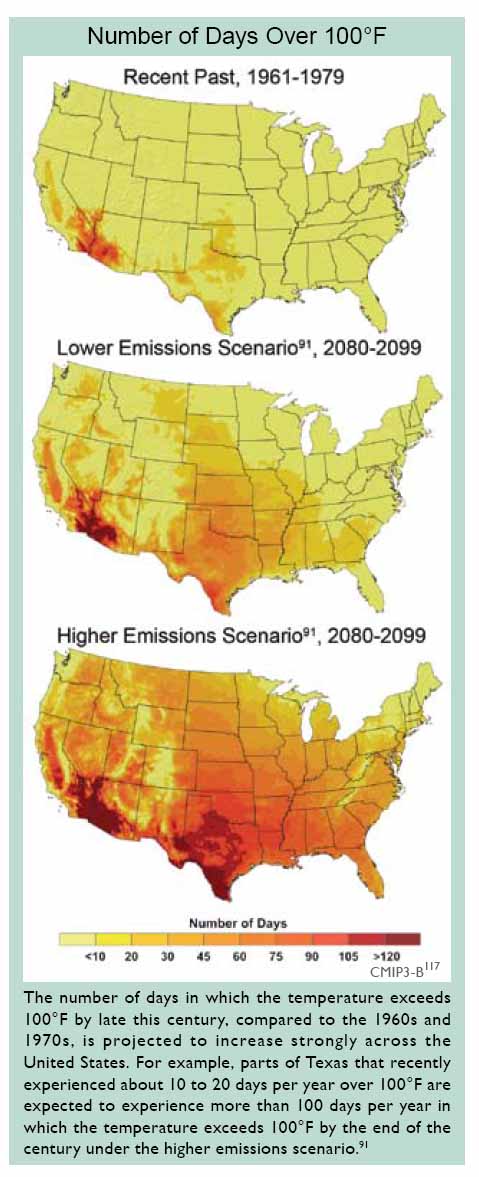 nates
and integrates federal research on changes in the global environment and their
implications for society. The USGCRP began as a presidential initiative in 1989
(Reagan - Bus) and was mandated by Congress in the
Global Change Research Act of 1990 (P.L. 101-606), which called for "a
comprehensive and integrated United States research program which will assist
the Nation and the world to understand, assess, predict, and respond to
human-induced and natural processes of global change."
nates
and integrates federal research on changes in the global environment and their
implications for society. The USGCRP began as a presidential initiative in 1989
(Reagan - Bus) and was mandated by Congress in the
Global Change Research Act of 1990 (P.L. 101-606), which called for "a
comprehensive and integrated United States research program which will assist
the Nation and the world to understand, assess, predict, and respond to
human-induced and natural processes of global change."
This report itself is written in typical science outreach style. There is no
alarm and very little risk presented. The wording is subdued with little
descriptive value. Little thought appears to have been given to allowing for an
understanding of the implications for the facts reported. This is a predictable
and lamentable characteristic of climate science reporting. But the risks
are immense, unprecedented and something that society has never experienced.
The reason that it appears that little thought has been given to the description
of the meaning of the impacts of the results in the report, or one of the most
important reasons, is that describing a future experience, that has never before
been encountered, is anything but an easy task. Simply reporting the facts is
straightforward and without much risk of error. One of the riskiest
statements in the entire report is "Some of the changes have been faster
than previous assessments have projected."
So to help with the understanding of the implications of the facts presented in
this report, consider the image on the right. This image was produced on page 91
of the report, but there was no text directly relating to the image, only a
related
discussion of the health related effects of a warming climate. However, the
reference for this image was 240 words and included three major papers and three
major modeling groups. If you pay attention to the authority given by
references, the information shown in this image has its own gravity.
The implications of this image are beyond extreme. Austin, Texas is located in the
middle of Central Texas. This is my hometown, so to me, this is personal. To
those who are not local, impacts relative to what will happen in Austin will be
widespread across the U.S.
In Austin, we normally have 12 days of 100 degree plus heat per summer
based on temperature records that go back to 1854
(for reference, Dallas has 18).
Because of climate change, Austin is projected to have, on average, between 90
and 120 days of 100 degree plus heat every year and 180 days (graph not shown)
of over 90 degree heat. This is more 100 degree days than Phoenix,
Arizona. Their average is 89 days. This is an astonishing thing see in a
report, but maybe what is more astonishing is the lack of description of the
implications of such a change.
Phoenix is located in the middle of the Sonoran Desert. This is a traditional
cactus and gravel desert with little to no water, blistering temperatures and no
trees or grass to speak of. Austin has our beautiful Hill Country streams and magnificent
live oak forests. If these temperature projections are correct, and there is no
reason to believe that temperatures will be any lower than depicted, Austin's summers
will be a third more extreme than those of Phoenix Arizona and about ten times
more extreme than Austin summers are on average.
This is an incredible statement to make. What it means is that all life,
outside of air conditioners, as we know it, will simply cease to exist in
Austin. There is absolutely no way that the vast majority of native plants and
animals around Austin could endure a summer that is a third again hotter than an
average Phoenix summer. What I have just told you is what is implicitly assumed from the information in
this image. Now let me add a complicating science concept into the
understanding of the impacts of this "warming" (I said complicating, not
complicated). Consider this: this concept is very simple. Science is
conservative by nature (the industry of science). A scientist must be absolutely
certain about the results of his or her discoveries or they will not be able to
publish their papers in the academic journals. The old saying about "publish or
perish" is absolutely true. If a scientist is wrong, the journals will not
publish his or her work. If the scientist can not publish his or her work, the
scientist will perish - there is no point in practicing science without being
able to publish scientific discoveries.
There is a quote from the report in the third paragraph of this paper that
states the obvious
"Some of the changes have been faster than previous assessments have projected."
Our climate could also be changing faster now, it could have
crossed through a climate threshold and likely has, but the principle of conservative science is
still valid. Because scientists are conservative by nature, their
results, their publications, their discoveries and their computer projections -
area all conservative. This means that the projections of 100 degree days is
also likely to be conservative.
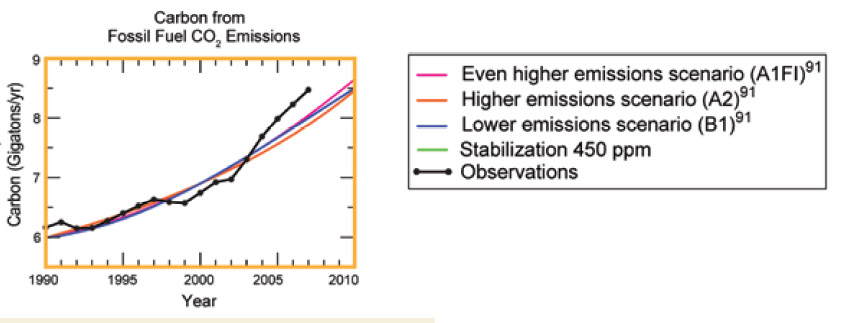
The graph above comes from USGCR. It is a combination of several sources
(another weighty reference) and shows the atmospheric load of greenhouse gases measured as carbon
(carbon dioxide and methane mostly) from the burning of fossil fuels. The black line with the circles represents
the actual atmospheric gas measurements, the purple line is the A1F1
supercomputer climate model projection, more commonly
known as the worst-case scenario from the IPCC 2007 Report. What the actual
measurements (black line) show, is that atmospheric carbon loading is increasing
faster than the worst-case scenario from the climate models. So our climate,
right now, is
changing faster than the worst scenario that the climate
scientists can calculate.
Temper this understanding with the realization that scientists publications are
conservative. Are their models so conservative that the actual carbon emissions
are greater than the models show, or are our emissions rising at a rate that is
even greater than expected? It matters little really. What matters is that
climate science projections are conservative. Whether they are conservative
because feedback mechanisms are increasing the speed at which our climate is
changing, or that scientists are just darned careful with what they say is not
really important. The results are the same for you and me.
At the end of the 21st century (2090 to 2100), my grandkids (if I ever get any) will still be
alive, and maybe even my 16 year old. At that time, Austin is projected to have
on average, of between 90 and 120 days (conservatively) of 100 degree plus heat
every year. This kind of heat is something that
very few on this planet have ever experienced. What will happen is complete and
utter devastation.
The environment in Austin will simply disappear; the trees, grass, wildflowers
insects, mammals and reptiles; very few if any will remain. The desert is
occupied by a different set of animals. A desert as hot as one that is a third
hotter again than the Sonoran has very few life forms at all. Some desert
animals will move into the the devastated Hill Country, but not many. There will
be no slow transition. This takes centuries. The desertification here will
happen in only decades.
There will be no more water, no more live oak forests, just like Phoenix, Arizona.
ont>
The streams and the river and the deer and the raccoons and possum will
disappear. This will
happen, not in a hundred years, but far before then.
Even half of this increase is far more than the Central Texas environment can
deal with as an average number of 100 degree days in the summer. But some may say -
we had 68 days of 100 degree heat last year in the summer of 2009. Yes that is
true, but it was the second highest number of 100 degree days ever to occur and
the old record is likely suspect. There were a few years in Austin when the
weather station was on the university campus, situated too close
to a building. At this time (in 1923 and 1925) there were 67 and 69 days of 100 degree heat.
The third place record was 42 days. The hottest year since was 2008. This
year saw the third ranked most number of 100 degree days at 50 - breaking the
previous record by 20%. It is little less than statistically
absurd to say that the 1923 and 1925 records are valid when the third place
record is 27 days less. So in all likelihood,
2009 shattered the all time 100 degree day record by 17 days.
Now you may be thinking
that this record breaking is statistically absurd as well, and you would not be
wrong except for one little thing. The dataset is changing. The scientists have
said that our climate has changed beyond its normal variation. The "change" in
climate change has already begun. We have crossed a threshold and have
entered into a new era of climate.
In August I returned from two and a half weeks filming some of the 52 million acres of
dead trees in the Rockies. The trees have been killed by a warming climate.
Stress due to warming
has created a natural beetle infestation that is 20 times larger than the
largest beetle infestation ever recorded. These are mountain pine
beetles and they kill trees in order to reproduce. Just two and half degrees of
warming in the Rocky Mountain West, approximately twice as much as the average global increase, has caused
this catastrophe that increased 18 million acres between 2007 and 2008. It is
completely out of control and is not expected to stop until all of the beetle's
food is dead (they only eat live trees). The forest professionals are now
concerned that the infestation will turn into a continent wide event, in the not
to distant future.
So I come home from this trip and I find trees dying in Austin. They were dying
because of the greatest drought ever recorded in Austin. Greater than the Dust
Bowl and greater than the drought of the 1950s. There were elm,
hackberry and oak, creek plum and ash juniper as well as several species of
shrubs that were dead. Some of these may come back next spring, The elm is
one that can stand a few drought induced defoliations, but not likely much of
the rest of this list. Fortunately there were only thousands of individual trees
dead, not millions of acres like what is happening in the Rockies. And we have
had some rain now, so the immediate threat is over, for now.
This climate change thing is so much bigger than people realize, and it will
happen a lot sooner than the end of the century. This date is simply a calendar
time frame. We are already feeling the effects now - 18 million acres of trees
dead last year in the Rockies. That would be nearly eight trillion trees, in just
one year.
The squirrels, cicadias, crickets, toads, crawfish and
snakes, salamanders and bats - they all will disappear. They will not just move
on, there will be mass extinctions, or at least mass death.
They will not be able to move on because there will be no place for them to go.
Ecosystems do not just reproduce themselves at the drop of a hat. An environment
is something that takes centuries to become established. Our climate is out of
control now, we do not have decades much less centuries to reestablish
ecosystems anywhere. Even if we did - many of the animals that live here now are not
migratory animals. Some would survive through what is called range expansion. This is basically random animal movements that serve to spread an animals
population into an area that is hospitable for them. But most animals around
here would not move if they had the chance - they do not know how.
Plants would
not migrate either, at least not in time periods as short as decades. Plants do
migrate, but not to far-northern Wisconsin or upstate New York in less
than a century, at least not most plants. This
is the scale of this temperature change - Wisconsin and New York will have
Texas-like temperatures at the end of the century. It is 1300 miles from Austin to
northern Wisconsin and
1500 to New York City. Can these places take the Texas heat? Likely, they
will be able to take it no better than Austin takes heat a third more intense
than the Sonoran Desert.
To put this into perspective, so that you can better understand why there will
be mass death of plants and animals in the relatively near future in the Austin
area, the actual warming will be even greater than the 90 to 120 days of 100
degree plus heat per year, because our climate change is already faster than the
worst-case scenario.
I HAVE TO REPEAT THIS ONE MORE TIME BECAUSE IT IS SO IMPORTANT. It will be greater than ten times hotter than normal, greater than twice as
hot as last year's record shattering heat wave and a third hotter than
Phoenix, Arizona in the middle of the Sonoran Desert. These will be the average temperatures.
The extremes will be
even hotter. Last year's likely record setting 68 days of 100 degree heat was
about six times hotter than average. So when we have a heat wave in the year
2090 like we did last year when we experienced 100 degree days six times more
than normal, we will see six times greater than the normal 2090 average days of
100 plus degree heat, or some 600 days per year... Get the picture?
Read the
Executive Summary of Global Research Change Program. No read the whole
report. This is extremely serious, and deserves your full and undivided
attention. The two Issues I have spoken o fin this discussion are just row of
several hundred that are equally as impelling. the report says what I have been trying to get across here for
the last two years. Can the Earth support the kind of changes that have already
begun with impacts that are worse than expected, that will only intensify, that
will happen still faster than expected with impacts that will be ever worse than
expected? No, absolutely not, nothing near so. The Rockies
are showing us that just a few degrees can kill a forest. The scientists say
that forests across the continent will likely die. The foresters say that it
will take one hundred years to grow back, but in a hundred years, the average
temperature in the Rockies will be 13 degrees warmer than it is now. This
beetle pandemic and great tree death in the Rockies has been caused by 2.5 degrees of warming.
Global Change Research Program
November 16, 2009 New Pine Beetle Outbreak in
Alberta, Canada is Worst-Case Scenario
It was hoped that the last several years of wet and cold in the Rockies would
put a damper on the great pine beetle infestation ongoing. In 2008, the
infestation increased 18 million acres. The last record breaking pine
beetle infestation in North America was three million acres in ten years. This
event ended about the turn of the century in Alaska.
In-fact, northern Alberta did experience a significant die-off of pine beetle
last winter says a report by the Canadian Forest service. This was the only
place in North America to see a die-off of any extent because of the cold.
But this summer, northern Alberta saw a mass inflight of beetles from British
Columbia that rivaled or was even larger than the flight in 2003 that started
this infestation. At the timer, there was a quote from a Ranger then that said
the beetles "fell like rain".
Northern Alberta is on the edge of the great boreal forest. The beetle has never
before been seen in northern British Columbia. The forest professionals are now
saying that the black and jack pines that dominate the boreal forest are at
great risk from beetle attack, and that this is likely the primary pathway that
the beetle will choose to infest what the scientists fear may be the rest of the
continent.
http://ca.news.yahoo.com/s/capress/091116/national/mountain_pine_beetles
http://green.ca.msn.com/news/canadianpress-article.aspx?cp-documentid=22436668
November 15, 2009 Great Britain public "beliefs" about
climate change are as uninformed as those in the U.S. In a
poll for the London Times, "Only 41 percent accept as an established scientific
fact that global warming is taking place and is largely man-made. Thirty two
percent, believe that the link is not yet proved; eight percent say it is
environmentalist propaganda to blame man and 15 percent believe the world is not
warming. Only slightly more than a quarter (28 percent) think climate change is
the most serious problem that the world faces."
(see here)
Climate change is the greatest counter-intuitive philosophical problem of all
time. The science is so complicated, the vested interests so powerful, the
climate lag so long, the amount of change required to produce critical impacts
is so unexpectedly small - and the ability of society and our leaders to
understand sophisticated science so limited - it is a wonder that there is as
much comprehension as there is.
Right now, major ecosystems around the world are failing, some catastrophically,
yet the public is grossly unaware. Caribou herds are collapsing, there is pine
beetle pandemic 20 times larger than ever recorded before and it will likely not
stop until it encompasses all of North America and primary productivity in the
Great Southern Ocean has begun a decline that will likely see the extinction of
a major component of primary productivity on earth. (here,
here and
here)
http://www.timesonline.co.uk/tol/news/environment/article6916648.ece
November 7, 2009 Al Gore joins James Hansen in
advocating civil disobedience to force action on climate change
Why are these two very prominent and very important national and international
leaders advocating breaking the law to force action on climate change?
Because without extreme measures, we are virtually guaranteed of dangerous
climate change. The following are three quotes from the guardian's interview of
Al Gore:
"Civil disobedience has an honorable history. When urgency and moral clarity
cross a certain threshold, then I think that civil disobedience is quite
understandable and it has a role to play," he said. "And I expect that it will
increase, no question about it."
Mr. Gore recognized the increased fervor of the contrarians as being
attributable to "the sunset phenomenon, where there's a spectacle just before
the subsiding". The phenomenon would see the remaining climate contrarians,
moneyed interests, and the like mounting one last campaign to forestall the
inevitable climate change prevention and mitigation regulations. Gore says "This
self-interest on the part of some of the carbon polluters, who are becoming a
bit intense in their efforts, reflects their awareness that public opinion has
been shifting very significantly. We have a tendency as human beings to confuse
the unprecedented with the improbable. If something has never happened before,
we tend to assume it will not happen in the future. [But] throughout history,
there have been examples of human societies confronting dire threats, and
finding, in their response, that they were capable of more than they thought
they were capable of."
We
are on the brink of and may have indeed passed into a phase of dangerous climate
change. But what exactly is this thing called "dangerous climate change".
It is something mankind has never experienced, and that even in ancient pre
history, the Earth has never experienced. Sure, it has been warmer on Earth than
it is today, but this heat has occurred when the Earth was a vastly different
place. Our atmospheric gas composition (oxygen, nitrogen, etc.) was entirely
different back then, so was the distribution of the continents across the planet
that created an entirely different
ocean circulation
heat budget. The most important supercomputer modeling climate scientist
in the world says that 20 to 40 degrees of warming, given today's continental
configuration and atmospheric gas composition, will evaporate the Earth's atmosphere and oceans.
We have 9 to 12 degrees lined up in the
conservative IPCC report already in the next 100 years
(here) and it is more likely than not that even more will occur beyond the
turn of the 22nd century. A long time before we evaporate our atmosphere and
oceans into space, our planet will become
uninhabitable. This is dangerous climate change.. What are we gonna do?
http://www.guardian.co.uk/world/2009/nov/07/al-gore-interview-climate-change
November 6, 2009 Ecological consequences of a
warming planet - Earth's Caribou population has collapsed - Foreshadowing
ecological trends across the rest of the planet The
International Polar Year resulted in this study by a team of 25 Arctic
researchers. Seven degrees of warming in some parts of the Arctic have changed
more than just the average temperature. The Arctic biosphere is collapsing.
Arctic sea ice is projected to disappear like it has not done in 14 million
years (here). As the permafrost melts
it is replaced by lakes. The lakes then drain or evaporate and leave a wasteland
of huge potholes that do not support the ecosystem that once flourished on top
of the ice.
Nine of Canada's eleven caribou herds are in decline.
The Bluenose West herd in the Northwest Territories had a population of 80,000
at the turn of the century; it was under 20,000 animals in 2006.
Northwest territory biologists say that the Bathurst herd of the central barrens
had fallen from over 120,000 animals in 2006 to 32,000. This is a loss of
nearly 90,000 caribou in three years.
An aerial survey could not even find enough of the Beverely herd to get
statistically valid data for a cow / calf count. This herd of 280,000 in 1995
has almost completely disappeared..
Warmer temperatures in the winter mean more and wetter snow. This makes it more
difficult for the caribou to find food as the snow is much more difficult to
fling aside with flick of the caribou hoof. Warmer temperatures in winter also
mean more chances of ice storms which coat everything in ice making it even more
difficult for the caribou to break through to find food. Warmer temperatures in
summer mean more insect pest. The caribou spend much of their time trying to
evade these pests, running about in fits and starts to get ahead of the slow
flying bugs and shaking incessantly. The results are that they feed less
in this time of plenty and expend more energy than normal, weakening the animals
already over weakened by the extra exertions and diminished food intake from the
winter.
Caribou herds have fluctuated wildly in the historic past, but this is not the
historic past.
Climate change has moved our planet's climate out of the range of historic natural
variability - beyond what we have experienced in recorded history. Our climate
has changed.
Polar amplification has multiplied the change in the Arctic. (More warmth means
less snow. Less snow reflects less heat back into space, so there is more
warming, which melts even more snow, even sooner, etc.) The
environment where Arctic ecology evolved has now abruptly changed. One can not
create an organism through evolution, and then abruptly move that organism to a
different environment and expect it to thrive, or even expect it to survive in
many cases. We are experiencing an
abrupt climate change. When abrupt climate changes have happened in ancient
prehistory, fossil records have shown us that great extinctions have taken
place. We have come to understand that abrupt climate changes are much
more numerous than ever imagined in the past and happen every few thousand
years.
The most dire foreshadowing of this journal article however is that the collapse of Earth's Caribou herds
is only one of the first of many. The report warns
that the Arctic, because of the polar amplification effect, leads the rest of
the world in the impacts of climate change. What occurs in the Arctic today can
be expected to occur across the rest of the planet in the future. and if the
recent past is any predictor of the future, the changes will happen faster wand
with greater impact than we are expecting.
Vors and Boyce, Global declines of caribou and reindeer, Global Change Biology,
May 2009
Post, et. al.,
Ecological dynamics across the Arctic associated with recent climate change,
Science, September 2009.
October 24, 2009 2,000 year-long Arctic cooling
reversed in the last 100 years Scientists have known for a long
time that our Earth has been cooling naturally since the last thermal maximum
about 7,000 years ago. At least intuitively, from all of their paleoclimate
knowledge, our climate should be following the normal pattern of
astronomical cycles. These natural cycles say that Earth should have
been cooling for quite some time now.
But something that most people do not understand about the industry of science,
is that scientific proof is more difficult to come by than a murder conviction.
That's right. A murder conviction can be handed down by a judge and jury based
on evidence that is "beyond a reasonable doubt". This is called
circumstantial evidence, and many a murderer has been sentenced to prison and
even death because of circumstantial evidence. But science doesn't really
accept circumstantial evidence as valid. There are certainly some instances
where a strong enough case can be made for circumstantial evidence in science,
but these instances are the exception rather than the rule. Scientific fact is
based on certainty, not circumstantial evidence. So proving something that
happened before written records is often extremely difficult.
This is one reason why science literature is littered with descriptors such as
"could be" "likely" "possible", "may", "might" and "could" instead of "is",
"are", "did", "was", "actual", "absolute" and exact". The general public doesn't
understand this and when they see the ambiguous wording in reporting of new
discoveries, they are skeptical about the validity of the science. Before
this study, only bits and pieces of facts existed that showed what scientists
have know "circumstantially" for more than a century.
This rigorous new study of Arctic temperature research has assembled enough
facts to go beyond circumstantial evidence in the understanding of Arctic
temperatures over the last 2,000 years. It looks at algae concentrations, pollen
counts and species distribution in lake sediments, sediment thickness and
composition and glacial ice and tree rings in the Arctic. The results of the
study confirm a widespread disruption of a 1900 year-long cooling trend in the
Arctic that has happened since 1900. (The cooling trend obviously goes back to
the thermal maximum 7,000 years ago, but this particular science ca not say that
without invoking circumstantial evidence, so it goes unsaid.) Natural orbital
cycles should have caused a gradual cooling of Earth since about 7,000 years ago
at the last celestial thermal maximum. This was when the earth was closest to
the sun and the tilt of the earth's axis was such that the northern hemisphere
was closest to the sun. These situations on occur every 21,000 years and when
they do, Heating on Earth it's greatest point in that 21,000 year-long cycle.
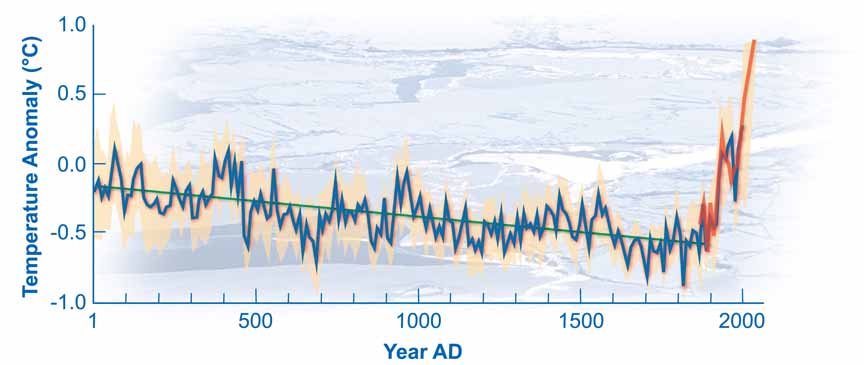 We
did see this happen in reality and then for 7,000 years Earth cooled. This
cooling of about 0.2 degrees C per 1,000 years continued up until about
1900 when there was an abrupt warming of 1.4 degrees C (2.5 degrees F). This is
the average warmth across the Arctic, some places have warmed much more like
northwestern Canada and north central Siberia.
We
did see this happen in reality and then for 7,000 years Earth cooled. This
cooling of about 0.2 degrees C per 1,000 years continued up until about
1900 when there was an abrupt warming of 1.4 degrees C (2.5 degrees F). This is
the average warmth across the Arctic, some places have warmed much more like
northwestern Canada and north central Siberia.
The authors identify the warming as being entirely man-caused from
increased greenhouse gas emissions. Otherwise our planet would be cooling now
because of the 21,000 year solar astronomical cycles.
Kaufman,
et. al., Recent warming reverses long term Arctic cooling, Science, September
2009.pdf
October 17, 2009 Television is not the place to learn about climate
change A study released today from George Mason University says that
the place where America spends the most time outside of work, is doing virtually
nothing to educate the public about the climate crisis.
The study analyzed a hypothesis called "reinforcing spirals framework". The
reinforcing spiral in this case is that knowledge of climate change tends to
increase the amount of continued learning activities centered around climate
change, for any given individual, and the more knowledge one has about climate
change, the more likely one is to continue to seek additional knowledge
concerning the subject.
This is a good description of the general state of public knowledge about
climate change from Dr. Zhao's report: "The phrase global warming first entered
public discourse in 1988, when National Aeronautics and Space Administration
climatologist James Hansen stated before Congress “with 99 percent confidence”
that global warming had already begun (Dilling & Moser, 2007). Today, polls show
that most of the American public is aware of global warming. Most Americans also
believe that global warming is real, and that human activity is a contributing
factor in global warming. Despite these perceptions, however, the American
people still think of global warming as an issue of low priority. Furthermore,
they believe that the ill effects of global warming are not likely to affect
themselves, but people in remote regions of the world and nonhuman nature (Leiserowitz,
2005, 2007)." It is also important to note that 60% of Americans, according a
Gallup poll, believe that climate change will not be a problem for them in their
lifetimes
(see here).
Professor
Xiaoquan Zhao's report says that the average person get's no significant
knowledge about climate change from television. Zhao found that perceived
knowledge of climate change (vs. real knowledge) increased the more one reads
the newspaper or uses the internet. Perceived knowledge is that knowledge
learned from any source that may or may not be accurate, reliable, true,
factual, etc. The effect of television viewing on perceived knowledge was
not significant; nor was is significant on perceived scientific agreement or
concern over global warming.
Male respondents reported less knowledge about global warming than female
respondents White respondents reported greater concern over
global warming than non-white respondents. People with more education had a
greater perceived knowledge and political party affiliation negatively predicted perceived scientific agreement and concern over global warming.
That is, Republicans were much less likely than Democrats Party to perceive scientific consensus and feel concerned over the
effects of global warming in the polar regions.
The public’s concern over the effects of global warming is an important driver
of individual action and public policy.
Research on global warming has shown that melting polar ice, sea-level rise, and
the extinction of polar animals are some of the important images American people
have about global warming (Leiserowitz, 2005, 2007).
AA parallel line of research shows that the U.S. media have adhered to the
convention of balanced reporting when covering global warming (ykoff, 2008;
Boykoff & Boykoff, 2004). This concept emerged in the 1970s with the
inception of the "Fairness Doctrine" by Congress. The Reagan administration
repealed the Fairness Doctrine, but the principles, which are exceedingly valid
for political or issue based reporting, are no less valid. The big problem
however, is that the media can not tell the difference between factual based
topics and issue or belief based topics. What happens is that the media gives
equal time to science based topics where contrary views of the science are
submitted to the public as factually based different opinions. This works
just fine when beliefs are involved, but the concept breaks down terribly when
facts are presented as being either believable or unbelievable based on the
opinion of the person being interviewed. Hence the reason why this study
looked at "perceived knowledge" instead of actual knowledge.
Zhao, Media Use and Global Warming Perceptions_A Snapshot of the Reinforcing
Spirals, Communications Research, October 2009
October 15, 2009
Director Pachauri says CO2 must peak by 2015
In an interview with the AFP Pachauri said that the emphasis for emissions
reductions for 2050 needed to be place on 2020 because of the unanticipated
acceleration of climate change. "Strong and urgent action is needed" said
Pachauri in a meeting of the ministers of the International Energy Agency in
Paris.
Pauchauri is chairman of the Noble Prize winning Intergovernmental Panel on
Climate Change. Pachauri said the talks in Copenhagen in December should focus
on the far more important target of 2020 instead of mid century. "It is not
enough to set any aspirational goal for 2050, it is critically important that we
bring about a commitment to reduce emissions effectively by 2020," he said. "If
this path of mitigation is to be embarked on, to ensure stabilization of
temperatures at the level that I mentioned (2 C, 3.6 F), then global emissions
must peak by 2015," he said.
The Chairman also opened the door to a follow up meeting to Copenhagen in case
the US can not get their climate change ducks in a row before December. PARIS
(AFP) - The UN's top climate scientist on Thursday urged a key conference on
global warming to set tough mid-term goals and warned carbon emissions had to
peak by 2015 to meet a widely-shared vision.
October 10, 2009 CO2 higher than any time in the
last 15 million years
A A paper in the journal Science last
week, published by a UCLA scientist (Dr. Tripati), shows that CO2 is higher
today than at any time in the last 15 million years. The study looked at
fossilized foraminifera, those tiny sea creatures that make up a large part of
ocean primary productivity, algae, plankton and the like.
The study of these creatures involves the analysis of their tiny shells, made up
of calcium carbonate. Calcium carbonate is basically limestone formed on the
ocean floor as countless numbers of these microscopic and near microscopic
creatures die and their empty shells accumulate. Limestone has carbon in it, the
carbon comes from carbon dioxide. The method used to figure the CO2
concentration of the atmosphere in this case is one of the most complicate. I am
going to try and walk you through it because it demonstrates one of the primary
reasons why climate change is so difficult to understand - that is because
it is so complicated!
Stay with me now:
Dr. Tripati and her team determined the boron to calcium and magnesium to
calcium ratios of the their fossil shells taken from sea cores drilled into the
floor of the Pacific Ocean using a mass spectrometer. From these ratios they
were able to determine the hydrogen ion concentration of the sea water at the
time the foraminifera created their shells. The hydrogen ion concentration was
able to tell them the pH or acidity of the ocean water, and ocean acidity has a
direct relationship with atmospheric carbon dioxide concentration. The actual
experiment was hundreds of times more complicated than this, I could only wish
that I was smart enough to understand everything in the report, much less the
supplemental information.
An interesting note in the Tripati paper: Sea level was 80 to 130 feet higher 15
million years ago, when CO2 was the same concentration or a little higher than it
is today. One of the most obvious things that the scientists say about our
current CO2 levels when compared to prehistoric sea levels is that we have
raised CO2 so high so fast that ice melt has had nowhere near enough time to
catch up. What this means is that the climate today, because of the great
distance between the normal relationship between CO2, temperature and sea level,
is far, far from anything ever experienced on this planet in time frames that
matter.
Tripati, et. al., Coupling of CO2 and Ice Sheet Stability Over Major Climate
Transitions of the Last 20 million years, Science Express ,October 8, 2009.
September 15, 2009
Contrarian Logic is
Irreversible
Anthony Watts, a 25 year broadcast meteorologist,
has published an essay with the Heartland Institute. I have heard about the
Heartland Institute, their Exxon ties and contrarian climate change propaganda,
but I have never visited their website. So I made a quick trip. I noticed
Tobacco on a prominent tab at the top of the site and clicked. Within
30 seconds I found this quote "11 out of 12 life-long smokers don’t die before
the age of 75 from a smoking-related disease." Wow! This is fantastic!
This is the opening sentence of the websites discussion of climate change
"Global warming is a prime example of the
alarmism that characterizes much of the environmental movement."
Their
disdain of the environmental movement is obvious, too bad they have never read
Silent Spring. So I clicked on alarmism just to see what would
happen and
within less than 8 seconds
I found this article on the websites policybot, or some such.
Hansen Still Embarrassing NASA After 2 Decades So, if Hansen is still
embarrassing NASA after 2 (sic) decades, why is he still the director of GISS?
But I appear to have digressed. I made it about half way through Mr. Watts essay
and found that it fairly well confirmed my fears of sloth in technological
pursuits across the land. I do feel that much of the information he has
presented is misleading or irrelevant, but none the less, I do not doubt that
there are many problems with the U.S. temperature record. One thing in
particular that I could not understand in Mr. Watts essay however is the
mechanism by which Stevensen screen
paint
(thermometer shelter - latex or whitewash) can affect minimum temperatures.
There was a Weather Service policy change in 1979 that changed the Stevensen
Screen paint specification from whitewash to latex. Latex has different
thermal properties than whitewash. The essay says that the latex paint causes
maximum temps to be 0.3 degrees C warm and minimum temps to be 0.8 degrees warm.
No data, plots, graphs or supporting material is supplied with the essay. I do
not understand how any coating or paint can cause minimum temperatures to be in
error. Heat gain from additional infrared absorption during the day by latex
paint is understandable and mentioned in the essay, but no explanation of how
the minimum temperatures (at night) are increased by the latex paint.
The balance of this essay was consumed with the details of incorrect and out of
scope screen location, installation and operation of official weather stations.
Shocking yes, and I do not doubt the perceived validity of the claims, but
important to the discussion? If a warming temperature was all that climate
change was about, we would have no problems. All that would be needed would be,
well nothing... The air conditioner thermostat would take care of everything.
But of course this is not about running the A/C a little longer at every cycle
to keep the girls cool. This is about changing the environment of our planet.
This Earth has evolved in a given range of temperatures; every piece of life on
this planet. Mankind is the only organism that can control his own environment.
Everything else must adapt of perish.
What we are finding, with greater rapidity and more robust certainty every year,
is that changes are happening more rapidly than were expected and the impacts
are greater than expected. It matters not if these changes are happening
because of a 1.2 degree warming or a 0.6 degree warming. Environments are
changing and organisms are perishing. Our Earth scientists are learning more and
more about the risks and dangers to our Earth systems that are already happening
and they are finding that the feedbacks are likely more sensitive and less
reversible than previously assumed.
The two things that these contrarians are proving by wasting our time with these
trite arguements is that they do not understand the overall ramifications of
climate change, regardless of how much the thermometers says the climate is
changing, and that they disregard the risks of irreversible climate change
completely.
Watts Essay
href="http://wattsupwiththat.files.wordpress.com/2009/05/surfacestationsreport_spring09.pdf">
htthttp://wattsupwiththat.files.wordpress.com/2009/05/surfacestationsreport_spring09.pdf
August 14, 2009,
Warmest Oceans Ever Recorded NOAA's global
temperature report shows that our Earth's oceans are now warmer than they have
been since record keeping began in the 1880s. the combined land /ocean
temperature for July 2009 was 1.03 degrees above the 20th century average of
60.4 degrees F or the fifth warmest ever recorded. The global ocean temperature
was 1.06 degrees F above the 20th century average of 61.5 and beats the previous
record set during the last super-El Nino of 1998. The global land surface
temperature for July 2009 was 0.92 degrees above the 20th century average and
tied with 2003 as the ninth-warmest July on record. The January through
For the year to date, the global combined land and ocean surface temperature of
57.9° F tied with 2004 for the sixth-warmest on record.
July 2009 was the 33rd consecutive July with an average global land
and ocean surface temperature above the 20th century average. The
last July for the temperature to be below average was in 1976.
NOAA News
http://www.noaanews.noaa.gov/stories2009/20090814_julyglobalstats.html
NOAA State of the Climate Global Analysis July 2009
hthhthttp://www.ncdc.noaa.gov/sotc/?report=global&year=2009&month=7&submitted=Get+Report
July 28, 2009 How will Earth's temperature change
in the coming decades?
I try not to present too many
summaries of climate models in this journal, but a trend is emerging in academia
that I need to speak about this review is about an article in Geophysical
Research letters by Judith Lynn and David Rind from the Naval Research Lab and
NASA GISS. What is going on is that the academics are recognizing, in their
publications, the reasons why global warming has slowed in the last six or seven
years and and that these things, these naturally cyclical and recognized climate
variables, are changing to conditions that will no longer mask the warming that
has been occurring right along.
These masks are: the relatively long period where La Nina dominate the southern
oscillation, the cool phase of the pacific decadal oscillation and the solar
minimum. El Nino is back and he will probably be here more often than not for
quite some time. The recent string of La Ninas and weak El Ninos will
likely not be repeated until the next cycle
The Pacific Decadal Oscillation has just moved out of a cool phase and into a
new warm phase.
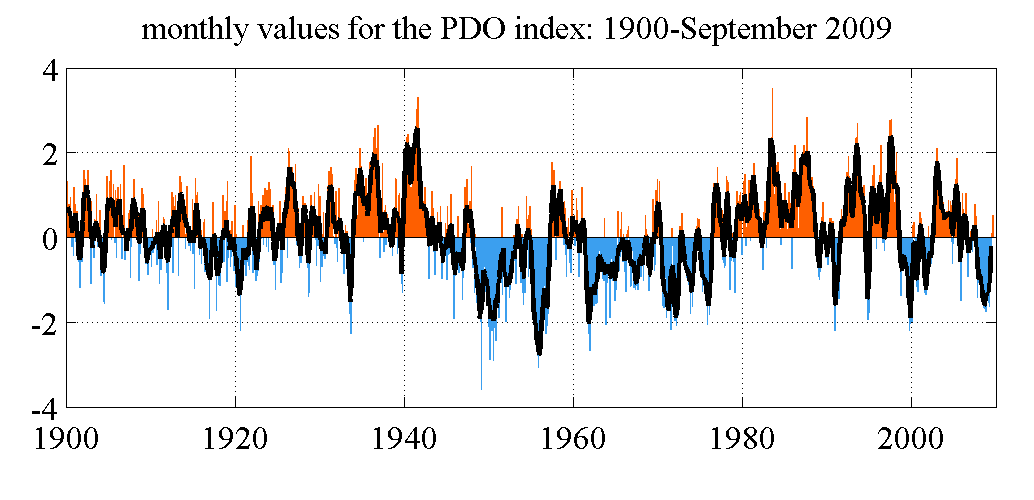
The solar minimum has been at its greatest in over 96 years. The minimum cycle
is ending now and the effects of the cooling caused by the solar minimum will
soon be gone.
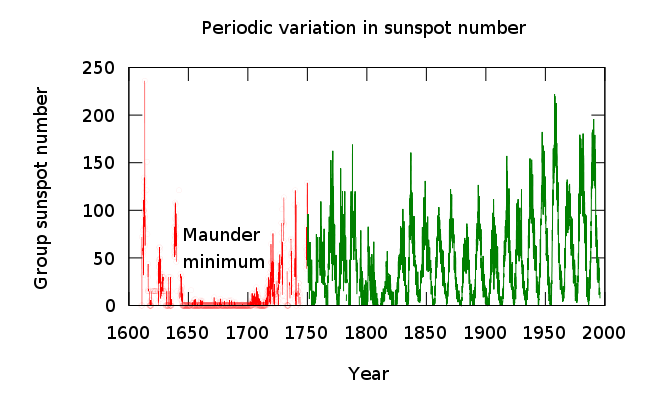
These cycles are ending or have ended now. There is some lag between the cause
and effect. For instance, I found a reference to an approximate two year lag
involved with the solar minimum. Once the climate lag has run its course,
the warming that these mask have been hiding will return. This is what Lean and
Rind talk about in their paper.
What these two scientists did was to look at the past and project short term
climate forcing patterns into the future based on the history of these short
term climate forcings (sunspots, ENSO, PDO, etc.)These researchers have
identified these patterns and their specific cooling impact on our climate since
2002.
Their specific modeling of the return to normal conditions shows that
warming will be 50% greater than anticipated by the IPCC.
This type of thinking seems to be spreading across academia. James Hansen is
another that I can lay my hands on a reference, who says that in another
year or two or three, when the warming signal comes out from behind the
temporary masks, we will see successive years where global average temperature
is the warmest ever experienced, year after year, for many years.
Lean and Rind, How will Earths temperature change in the coming decades,
Geophysical Research Letters, August 2009
June 25, 2009 James Hansen arrested for Civil
Disobedience Dr. Hansen is practicing what he preaches. In
September 2008, at the Kingsnorth Six trial in Great Britain, where six
protesters were on trial for painting graffiti on a smokestack at a coal fired
power plant, Dr. Hansen made
his policy on public disobedience public. Dr. Hansen says that, because our
society appears that it is not willing to stop using coal in time to save our
planet from dangerous climate change, we must resort to civil disobedience to
raise awareness of the climate crisis to a point where society will take
appropriate action.
He was arrested today at the Goals Coal plant in Sundial West Virginia for
protesting mountain top removal coal mining. class="style40">
Dr. James Hansen is the Director of the NASA Goddard Institute for Space Studies
which is the primary U.S. Government climate modeling agency.
The implications of Dr. Hansen's actions are profound.
http://www.miamiherald.com/news/environment/story/1114473.html
June 18, 2009 UK Met, New Mega Report for Great
Britain - Four degrees F by 2040, even with strong mitigation measures.
Summers will be drier and winters wetter with about the same total
rainfall. this will create a greater chance of flooding. Total warming for
England by 2100 is 7.2 degrees F. above 1990. (The consensus understanding is
that 3.6 degrees above pre industrial levels is the maximum limit for the onset
of dangerous climate change. The twentieth century saw 1.0 degrees of warming
which leaves us with only 2.6 degrees to reach the limit.
For the first time a sea level rise was assumed for a worse case scenario, the
new number is 6.2 feet. The UK Met reports that achieving this sea level rise is
highly unlikely, but they go on to explain how they derived the estimate. Their
reference comes from a paper by Rholing et. al. in 2008 that describes sea level
rise during the last interglacial peaked at 1.6 +/- 0.8 meters per century. This
means that worst case scenario is 7.9 feet. The last interglacial period was the
last time the Earth was in-between ice ages like we are today, and the Earth was
as warm, or close to as warm is it is today. Different however, is that the
Earth is already as warm or within one or two degrees F as warm as it has been
in the last 3 million years. By 2100, the Earth will be warmer than at any time
in the last 20 million years.
http://ukcp09.defra.gov.uk/index.html
June 17, 2009 United States Global Change Research Program
New mega
report - Climate Change is her now and getting worse.
http://www.globalchange.gov/publications/reports/scientific-assessments/us-impacts
June 12, 2009 "We've lost 80 per cent of the
living coral cover in the Caribbean over the last four decades" says Dr.
Nicholas Dulvy of the Simon Fraser University. The study
reviewed nearly 500 surveys of 200 different reefs all cross the Caribbean
between 1969 and 2008. The causes are varied and all are directly attributable
to climate change. This discovery is devastating beyond belief. We new this
could happen on a warmer planet, and we new that our coral reefs were being
impacted presently, but this was not supposed to happen until some point in the
impersonal distant future.
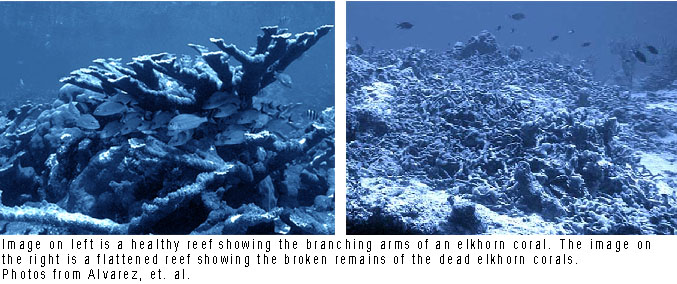
The marine biologist who study reefs define their complexity by their rugosity,
or how wrinkled or rough the reef is. A more complex reef is more wrinkled than
a less complex reef, and the greater the complexity, the greater is the amount
of and number of species a reef can support. What this team of scientists
have found is that structural complex reefs have been nearly completely wiped
out across the Caribbean in the last 40 years. In 1979, complex reefs accounted
for 48% of the total number off reefs, in 2008 they accounted for just 2%.
Alvarez-Filip et. al., Flattening of Caribbean coral reefs: region-wide declines
in Architectural complexity, Proceedings of the Royal Society B, June 2009.
Press Release University of East Angliaa>
Dr. Nicholas Dulvy Interview Toronto Globe and Mail
June 2, 2009 "Ocean acidification, one of
the world’s most important climate change challenges, may be left off the agenda
at the United Nations Copenhagen conference." Says the National Science
Academies of 70 nations. The science
academies of 70 nations addressed the opening of the climate talks in Bonn today
concerning the seriousness of emission cuts required to keep ocean acidity under
control. From the statement:
Ocean acidification is irreversible on timescales of at
least tens of thousands of years;
At current emission rates models
suggest that all coral reefs and polar ecosystems will be severely affected by
2050 or potentially even earlier;
Carbonate saturation, or the basics chemistry allowing primary productivity to
survive as at it lowest level in 800,000 years. If current trends continue
ocean acidity will be higher than at any time in the last 10 million years. (By
current trends, they mean those trends established over the last 30 or more
years. since the turn of the century, trends have been accelerating beyond those
of the last 30 years.)
The statement says: "The current rate of change is much more rapid than at any
time in the last 65 million years."
Ocean acidity changes are happening now across the globe and have already begun
to affect coral growth. In the Antarctic and parts of the North Sea, it has
already begun to affect primary productivity and mass extinctions are projected
between 2030 and 2050. (See
here and
here)
Even with stabilization of atmospheric CO2 at 450 ppm, ocean acidification will
have profound impacts on many marine systems. Large and rapid reductions of
global CO2 emissions are needed globally by at least 50% below 1990 levels by
2050. The highest emission reductions proposed to date are by the European Union
at 30% below 1990 levels by 2020. The U.S was (last month) proposing 20% below
2005 levels, which is about 7% below 1990 levels. Now the U.S proposal is
down to 17% or below 2005.
Cuts under Kyoto look like they will now be realized in the European Union, but
almost nowhere else. Worldwide, CO2 keeps rising at an accelerating rate.
Most developed countries today, including the U.S. are proposing cuts of 50% to
80% by 2050, or what it's worth.
Statement: Interacademy Panel on International Issues: A Global Network of
Science Academies
May 27, 2009 New USGS Study
Documents Rapid Disappearance of
Antarctica’s Ice Shelves This mega effort by the US
Geologic survey created a map of the Antarctic Peninsula Ice Shelves and their
retreat during the study period. The report summary quotes "The map portrays one
of the most rapidly changing areas on Earth, and the changes in the map area are
widely regarded as among the most profound, unambiguous examples of the effects
of global warming on Earth." The map is shown to the right and can be seen in
great detail following the links at the bottom of this discussion. Insets are
shown from a few of the retreating ice shelves below.
The USGS map shows the central part of the peninsula, centered on the Larson Ice
Shelf.
The general map below shows the Antarctic Peninsula in relationship to
the rest of the continent.
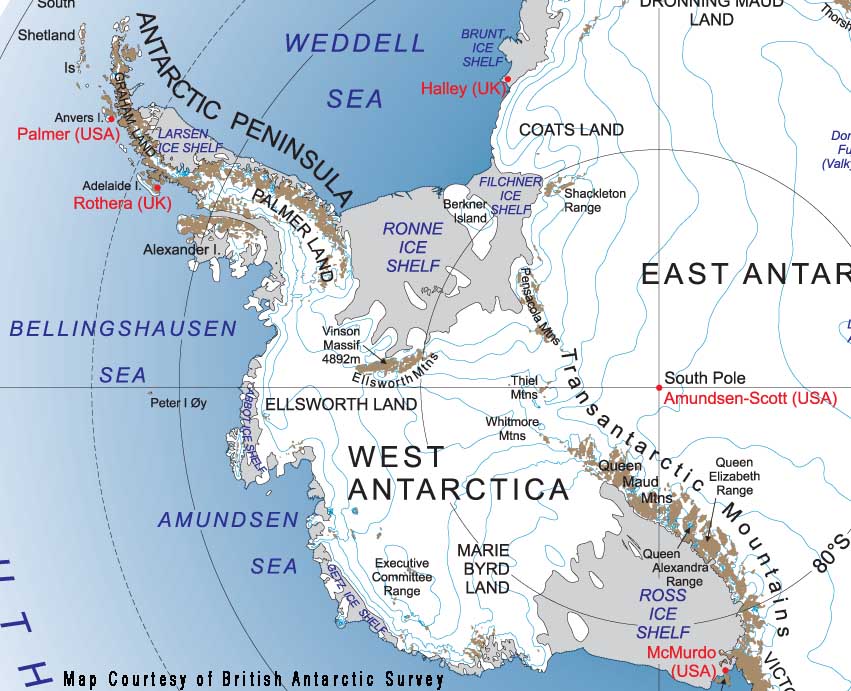
Over 7,200 individual measurements of ice-front location were made on 174
glaciers during the study period. The study showed a general and widespread
advance between 1940 and about 1960 followed by a general retreat in the 1960s
and 70s. The retreat became more pronounced in the 1990s and accelerated further
in the late 1990s. of the 174 coastlines that were measured, 82 percent or 142
showed retreat. The following image is an enlarged crop of the USGS map. The
Larson is on the right, the Wordie is in the square box on the left.
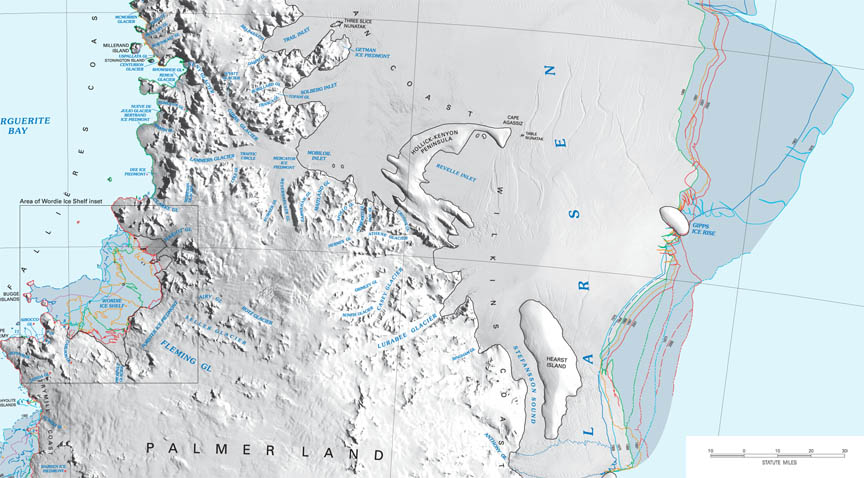
The different colored lines in the darker blue shaded areas show the ice edge on
a given date. The darker blue shading is the missing portion of the ice shelves.
The Larsen in the above map is actually the Larsen C Ice Shelf. The Larsen A and
B, both to the north, in areas that have warmed the most, have already
disappeared. The Larsen B, which disappeared in 2002, is shown below as the last
crop of this discussion. About 25% of the Larsen C (above) has disappeared since
the 1940s.
The retreat of the Wordie Ice Shelf was the focal point of intense interest in
excessive warming on the Antarctic Peninsula in the 1980s and 1990s. This
ice shelf completely filled Wordie Bay in the 1930s, retreat and expansion
occurred until the 1960s when this ice shelf set the trend for ice shelf retreat
on the Antarctica Peninsula. The ice shelf is almost completely gone
today.
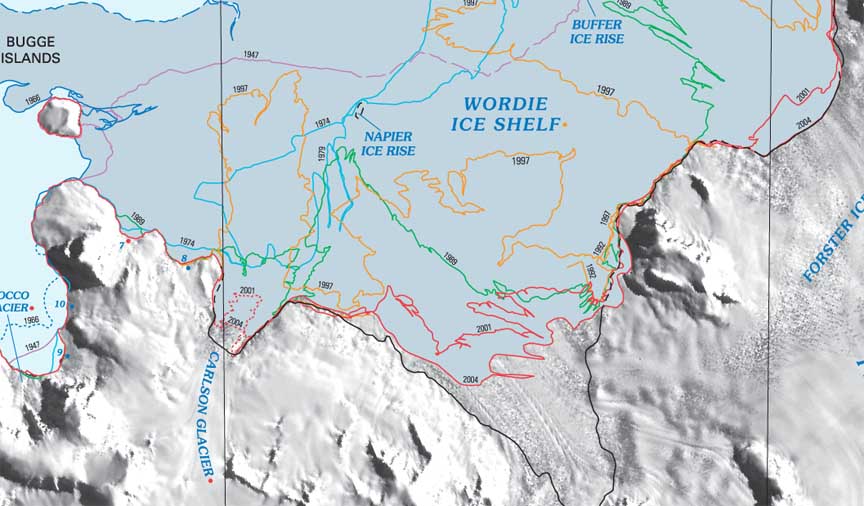
The Larson A, the smallest of the three Larsen Ice Shelves, disappeared in 1995.
Larsen B, the size of Rhode Island, disintegrated, literally, in 28 days in
2002. Meltwater had filled the thousands of crevasses in the ice shelf and the
weight of the water in the crevasses acted like wedges to force the cracks
through the 700 foot thick floating ice sheet.
The area of the rapid disintegration in 2002 is shown
between the 2000 and 2002 mapping lines.
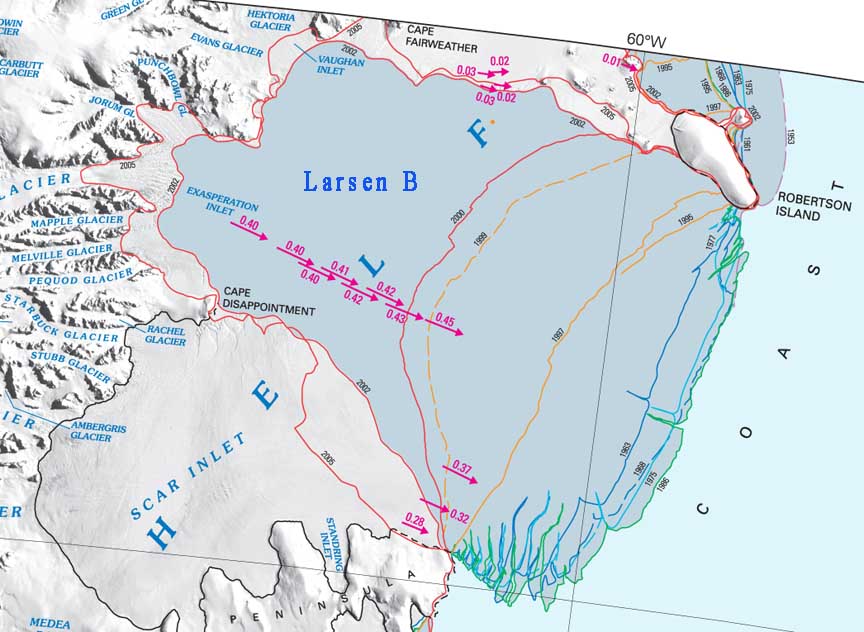
The Larsen C is now starting to show melt on the surface in summer, and the
bottom is melting from warming ocean temperatures. It is anticipated that
the the Larsen C may last another decade. It is the size of Vermont and New
Hampshire combined.
See the discussion of the disintegration of the Wilkins Ice Sheet (the size of
Connecticut), not far from the Wordie to the south west at the
April 25,
2009 discussion.
USGS http://www.usgs.gov/newsroom/article.asp?ID=2186
Report:
Ferigno, et. al., Coastal Change and Glaciological Map of the Larson Ice Shelf
Areas of Antarctica: 1940 to 2005, US Geologic Survey 2008.
May 25, 2009 Spring dust storms, earlier snow melt
- USGS scientist asks "Is this the new normal?" Twelve dust
storms this spring have coated the southwestern Rockies with dust speeding
snowmelt by 35 days earlier than average. The faster snowmelt will lead to
decreased runoff later in the season, a climate change prediction that is being
realized all too soon. The dust storm frequency was a bit unexpected however.
In the entire year of 2003, four dust storms hit the Rockies. Eight have
occurred in each of the last three years, and 12 just this spring alone. The
increased snowmelt is caused by the dust heating up as it soaks up the sun
light energy. Snow reflects up to 90% of the sun's energy, dust absorbs
over 70% of the sun's energy and turns it to heat.
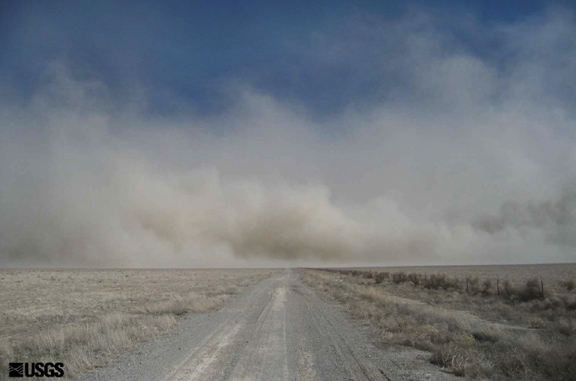
Outside of Fillmore, Utah, March 4, 2009.
The amount of dust in the Rockies recently has been five times greater than the
pre 1900 normal. The dust bowl of the 1930's saw dust levels seven times
the pre 1900 normal. Climate prediction models show the south western U.S.
seeing permanent dust bowl conditions by 2050. Like most other climate model
predictions, are we beginning to see dust bowl conditions a bit ahead of
schedule?
USGS http://sbsc.wr.usgs.gov/crs/news_info/dust_storms/
LA Times
http://www.latimes.com/news/nationworld/nation/la-na-pink-snow24-2009may24,0,1077488.story
May 21, 2008 MIT Study: Twice as hot as predicted
6 years ago. We have come to understand an enormous amount about
our climate since the turn of the Century. the latest and most accurate
super computer models are now predicting climate change far worse than was
predicted with the IPCC Fourth Assessment.
The MIT News release begins: "The most comprehensive modeling yet carried out on
the likelihood of how much hotter the Earth's climate will get in this century
shows that without rapid and massive action, the problem will be about twice as
severe as previously estimated six years ago - and could be even worse than
that."
The study sees 5.2 degrees C (9.4 F) warming by 2100 under an average scenario
with that considers the business as usual scenario. The range is 6.3 to 13.3 F,
just by 2100. Beyond 2100 the temperature continues to increase.
The model DOES NOT take into consideration many of the better known but poorly
understood feedback mechanisms such as methane release from permafrost melt.
MIT News -
Climate change odds much worse than thought
Sokolov, et. al., Probabilistic forecast for 21st century climate based on
uncertainties in emissions (without policy) and climate parameters. Journal of
Climate, May 2009
May 15, 2009 Met Hadley UK says "Even with
drastic cuts in emissions in the next 10 years, our results project that there
will only be around a 50%chance of keeping global temperatures rises below 2
°C."
The report says: "This idealized emissions scenario is based on emissions
peaking in 2015 and quickly changing from an increase of 2–3% per year to a
decrease of 3% per year. For every 10 years we delay action another 0.5 °C will
be added to the most likely temperature rise."
http://www.metoffice.gov.uk/climatechange/policymakers/policy/temperaturerises.html
May 13, 2009 The Catlin Arctic Survey: "Our science advisors
had told us to expect thicker, older ice on at least part of the route, so it is
something of a mystery where that older ice has gone. It'll be interesting to
see what scientists think about this."
A woman and two men pulling sledges nearly 300 miles across the Arctic sea ice
in the dead of winter; temperatures between 0 and -50F, 1,500 sea ice thickness
measurements. A short trip by polar standards, unless the sea ice thickness
measurements are taken into consideration. Although I have hiked around a
bit in the snow - gee whiz. What a great trip. But the sea ice thickness
measurements are disconcerting.
They found first-year sea ice on almost their entire route. the scientists
had told them they would see multi-year ice on at least part of their route.
http://www.catlinarcticsurvey.com/education_resources.aspx
May 10, 2009 Aerosols: Complicated atmospheric
chemistry responsible for 45% of warming in the Arctic. The
major aerosols are black carbon (see May 7), sulfates and oxides of nitrogen
(NOx). They come from combustion. Black carbon comes mostly from the burning of
most fuels in developing and third world nations where pollution controls are
not as stringent as in the developing world. Sulfates and NOx comes mostly
from coal and oil and again, less in the developed world because of more
stringent pollution controls.
We have found in the last few years that aerosols are nearly comparable to
greenhouse gases when understanding how our atmosphere responds to warming
energy from the sun. NASA scientists have published research findings in the
journal Nature Geoscience that show that aerosols, including black carbon, have now been shown to account for 45% of
recent warming in the Arctic.
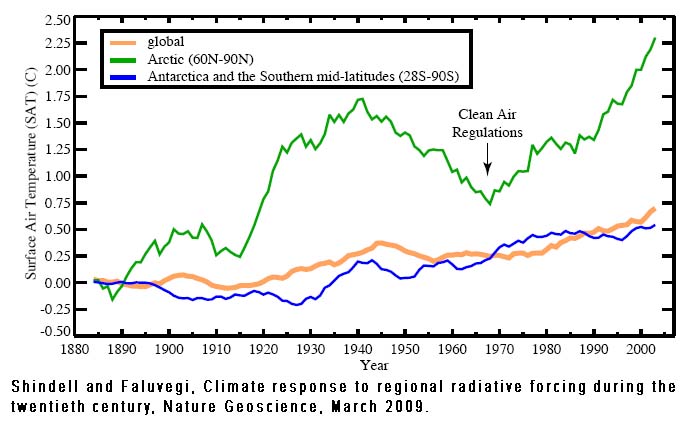
It all started with the industrial revolution. Greenhouse gases and aerosols
from coal and oil burning started to warm the planet. The warming was amplified
then, as it is now, by the polar amplification effect. World War I put a stop to
the warming; likely the complicated effects of aerosol pollution were
responsible. After World War I industrialization went into overdrive. Greenhouse
gasses and aerosols combined to warm the planet again. Then about the time that
World War II began, temperatures across the Arctic started to decline.
So how can increasing greenhouse gasses and aerosols cool the planet? Black
carbon has a net warming effect, but sulfates and NOx have a net cooling effect.
Atmospheric scientist now understand that our climate may be even more
significantly affected by aerosols than carbon dioxide for the next couple
of decades. The understanding is imperfect, but it has been widely acknowledged
for some time now that air pollution caused global temperatures to dip between
World War II and the early 1970s.
Then came clean air regulations. In 1963 the first Clean Air Act in the U.S. set
air quality standards for power plants and industry. In 1966 California enacted
air quality regulations for vehicles. In 1968, amendments to the Clean Air Act
went into effect to regulate transportation nationwide and strengthen
regulations for industry. In 1970 the Clean Air Act was completely overhauled
and strengthened again. The Arctic started its warming trend once more as the
skies cleared.
Now, air pollution in developing countries, with significantly less air quality
regulations than the developed countries, is complicating climate change. Most
of the knowledge about how developing nation's air pollution is affecting
climate has been centered around cooling. But just recently, several projects
have shown the opposite and the latest knowledge sees more warming than cooling.
The story is so complicated because sulfates and NOx do cool the planet by
reflecting sunlight back into space, but black carbon warms, mostly in the
middle and upper atmosphere. Sulfates and NOx however, create brighter clouds
that are less efficient at releasing their moisture as precipitation, which
warms the planet as it dries, but the clouds also reflect sunlight back into
space cooling the planet. Black carbon also dims the planet, creating less
clouds and less precipitation.
Stay tuned.
Shindell and
Faluvegi, Climate response to regional radiative forcing during
the
twentieth century, nature Geoscience, March 2009.
NASA Press Release:
http://www.nasa.gov/topics/earth/features/warming_aerosols.html
May 7, 2009 Black carbon (soot) has 60% of
the warming potential of CO2 and is a problem three to four times greater than
previously assumed.
Black soot comes from and biofuels such as wood and organic fuel in cooking
fires,
diesel and fuel oil emissions, wildfires, agricultural burning, etc. The problem is most severe in developing and third world
countries. New studies have shown that black carbon is far more significant at warming than
previously assumed. It is a major part of the Asian Brown Cloud or ABCs
that nearly constantly cloak much of Asia. It combines with other air pollutants
like sulfur dioxide and nitrogen oxides (NOx) to form a sort of super smog
(ABCs).
Black carbon traps heat on earth a little differently from greenhouse gasses.
When the suns energy (light) hits the black carbon the energy turns into heat
energy (infrared energy) just like when sunlight hits the Earth. Black carbon
also captures heat when sunlight reflects off of the earth and bounces back to
hit the black carbon in the atmosphere. The black carbon, in both cases, heats
up and transfers it heat to the atmosphere. Greenhouses gases works by capturing
that energy from the sun that has already been converted to heat when it hits
the Earth's surface by forming a gaseous "blanket" that prevents the heat from
escaping to space.
The new studies show that black carbon is 60% as effective at warming the
atmosphere as CO2. This makes it the second most important contributor, behind CO2,
in warming the planet.
http://www-ramanathan.ucsd.edu/testimonials/BlackCarbonHearing-testimony.pdf
2008
Shindell and
Faluvegi, Climate response to regional radiative forcing during
the
twentieth century, nature Geoscience, March 2009.
May 5, 2009 "There's been a super-rapid decline in the glaciers
of the region" This quote is from "Ice, Snow, and Water:
Impacts of Climate Change on Himalayan Asia & California",
University of California, San
Diego, Sustainability Solutions Institute.
Glacier National Park will not be the only place that is glacierless in 20 to 30
years. The scientists at this forum At UC San Diego are not optimistic about
most of the ice on this planet outside of polar regions. These high mountain
zones where glaciers once ruled have a changing climate that is amplified with
the same effect that causes polar amplification of climate change, mostly the
ice albedo feedback mechanism. This effect works much like defrosting an old
fashioned refrigerator freezer. It take a long time to get the ice to start
melting much, but once it does, it all melts pretty fast.
These glaciated regions contain the water that supplies between one and two and
a half billion people. The water is stored in snow pack each winter and slowly melts through the summer to fill reservoirs. Earlier melt
does a number of negative things to the water budget. As the glaciers melt,
the winter snows will melt much faster and earlier in the spring.
To capture the runoff more quickly, much larger reservoirs are needed.
As the annual snowmelt finishes earlier every year, the mountains will warm more
in the summer, delaying the onset of snow in the fall, diminishing the annual
snow pack. Less snowmelt and
moisture in the summer will feedback to create even drier conditions that cause
less rain in summer and delay the onset and quantity of winter precipitation
which speeds the melt even further in the spring.
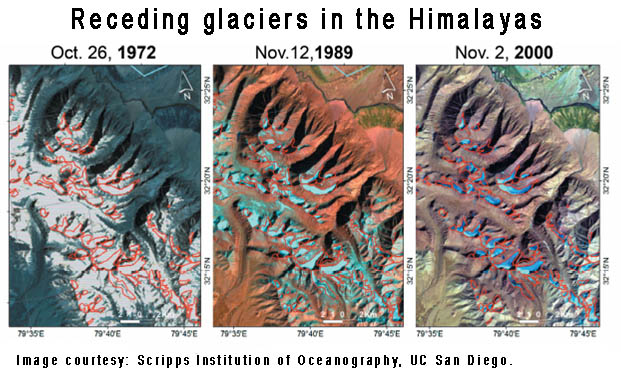
Charles Kennel, is a UCSD researcher who served as director of Scripps from 1998
to 2006; he says “We are trying to make it known that the Himalayas are to the
issue of the world’s water supply problem what the Amazon rain forest is to the
issue of deforestation,”
UCSD News
hhttp://ucsdnews.ucsd.edu/thisweek/2009/05/11_icemelt.asp
http://www.ipsnews.net/news.asp?idnews=46761
April 30, 2009 New Articles in the journal Nature
say climate change is worse than thought, is happening faster with greater
impacts and is going to be more difficult to control To
limit warming to 2 degrees C by 2050, the world must limit greenhouse gas
emissions to 275 gigatons between 2000 and 2050. Considering that we have
already emitted nearly one third of this 275 giga tons in nine years, this is
going to be "extremely difficult" says the author of the report (Meinhausen).
The research findings from a new super computer climate model were reported
today in the journal Nature.
Meinshausen et. al., Greenhouse-gas emission targets for limiting global warming
to 2 °C, Nature April 30, 2009.
April 30, 2009
"Profound ecological changes are occurring on
coral reefs throughout the tropics" quotes study team A team of
32 scientists have released a report that summarized 48 research project
covering 318 reefs and 273 reef fish species during the period 1955-2007. The
decline started about 1995. The scientists say the half of the fish species
groups studied are decreasing at 2.6 to 6% loss per
year. This loss rate is equal to 22 to 43 percent over 10
years. Because the species groups span game and commercial fish species as well
as non commercial and non game fish species, over fishing is not the problem.
What is happening is a result of coral reef decline due to climate change, put
more succinctly, "...drastic recent degradation of reef habitats...
indicate that Caribbean fishes have begun to respond negatively to habitat
degradation."
Corals cover has been reduced "drastically" across the Caribbean region
since the mid-1970s. The reduction is estimated to be 80% (Gardener 2003).
The reason that the team believe that the fish decline did not coincide with the
reef decline is that coral skeletons persist for decades. It is the structure of
the reef that provides much of the benefits of the reef habitat. After several
decades, this structure starts to disintegrate an so goes the fish
population.
Paddack, et. al., Recent Region-wide Declines in Caribbean Reef Fish Abuncance
Curent Biology, April 2009.
April 28, 2009 Arctic Monitoring and Assessment
Program study tells of profound changes
in the Arctic One of the quotes in the report states
"There continues to be widespread and, in some cases, dramatic evidence of an
overall warming of the Arctic system."
 The Arctic Monitoring and Assessment
Program is one of five Working Groups of
the
Arctic Council. The primary
function of AMAP is to advise the governments of the eight Arctic countries
(Canada, Denmark/Greenland, Finland, Iceland, Norway, Russia, Sweden and the
United States).
Four Indigenous Peoples Organizations and twenty three observing countries and
cooperating international organizations are a part of AMAP.
The Arctic Monitoring and Assessment
Program is one of five Working Groups of
the
Arctic Council. The primary
function of AMAP is to advise the governments of the eight Arctic countries
(Canada, Denmark/Greenland, Finland, Iceland, Norway, Russia, Sweden and the
United States).
Four Indigenous Peoples Organizations and twenty three observing countries and
cooperating international organizations are a part of AMAP.
Warming in the Arctic is greater than ever recorded and is occurring faster than
anticipated. Sea ice has decreased sharply, faster than expected, and the
Northeast and Northwest passages were open for the first time ever in 2007 and
2008. Most of the ice in the Arctic is now single year ice, that is very easy to
melt every year and shrubberies have started to grow in the tundra.
Many of these things may sound innocuous, but they have hidden and unexpected
impacts. Take the growth of shrubs in tundra country for instance. Snow reflects
90% of the suns energy completely back into space. Winter snow easily covers
tundra, but when shrubs start to grow, the snow depth must be much greater to
cover the greenery. This greenery can capture 70 to 80% of the suns energy
and change it into heat where it stays on the planet unlike that energy that is
reflected back into space by snow. So there is a difference of 8 or 9 times the
amount of heat generated between snow covered tundra, and shrubs that extend
above the snow cover. This is an immense amount of heat to add to an Arctic
ecosystem.
Permafrost is warming and melting. Snow cover is decreasing by 1% to 2% per year
(by half in 30 years). Ice free areas in the Arctic Ocean were as much as much
as 9 degrees warmer than their long term average. While growth in tundra areas
has increase, growth in boreal forests has declined.
Melt on the Greenland ice Sheet was the largest ever recorded in 2007 and 60%
greater than the last record year of 1998. Bird nesting and insect emergence
occur two weeks earlier and the active growing season has extended by one month.
Eurasian and North American runoff into the Arctic have both increased.
April 27, 2009 The
Potential for Catastrophic Sea-level Rise in the Near-future is Confirmed: 6.5
to 10 feet in 10 to 24 years Teams from the Institute of
Marine & Limnological Sciences, at the University of Mexico and the Institute of
Marine Science in Germany published a report in the April 9 scientific journal
Nature that shows a sea level rise of six and a half to ten feet in 10 to 24
years because of a catastrophic ice sheet disintegration. This sea level jump
compares similarly to those seen during the rapid warming out of the ice ages
only this one was right in the middle of the Penultimate Interglacial - the last
time Earth was as warm as it is today. This abrupt sea level rise happened about
120,000 years ago. The temperature then was likely several degrees warmer than
today, similar to what the latest computer models say we sill see 2030 or 2050.
The one big difference however
is that today we are pushing climate much harder than it has been pushed during
the most unstable periods in the last dozens of millions of years. During
the last interglacial, the climate forcing was relatively calm compared to those
during the unstable periods coming out the ice ages. It is these unstable
periods where most of these abrupt sea level jumps occur. The most widely known
are the 16 to 20 feet jumps recorded in Barbados 18,000 years ago (16 to 20
feet) that occurred as a result of the end of the last ice age./span>
NNow the scientists have
discovered that this sort of thing happens in between ice ages, in the
"interglacial warm periods" between ice ages. This research was done at a place
called Xcaret on the Yucatan Peninsula in Mexico.
The most likely culprit is the
West Antarctic Ice sheet. In a world similar to our world today, which is what
the world was like 120,000 years ago, it is likely that the West Antarctic Ice
Sheet, like today, was the only marine ice sheet in existence. It is these
marine ice sheets that are unstable and capable of catastrophic disintegration.
What makes them so unstable is that they rest on bedrock a thousand or more feet
below sea level with ice towering thousands of feet above sea level. As a
warming ocean melts ice below sea level the buoyancy of the ice is changed
causing the instability. The dynamics are poorly understood, but the results are
not./span>
TThis team of scientists
discovered these prehistoric sea level jumps the same way that those in Barbados
and other parts of the world were found – by looking at coral reefs. The reefs
are cored to see what their hidden growth layers reveal. These layers show
growth over time and are very similar to tree growth rings. The scientists
looked at the continuousness of the growth record and they looked at physical
things like sediment deposition, mass die-offs and algae buildup.
When a reef is suddenly
submerged by a rapid sea level jump caused by disintegrating ice sheets or land
subsidence from volcanic actions or earthquakes, etc., the shallow water corals
often die. Algal mats form on the dead corals and sand and sediment becomes
trapped in these new layers. Then, as ecological time moves forward, new corals
grow that are more at home at greater depths. This series of events forms a very
distinctive pattern in the coral cores that were recovered by the research team
at Xcaret.
What they found was there was
one to two generations of coral missing from the record, there was a mass die
off and a layer of sediment typical of that formed in other areas by abrupt sea
level rises. The particular species
of coral that was missing was the elk horn coral with an average life span of 10
to 12 years.
The implications, like so many other newly discovered impacts of climate change
on a slightly warmer planet from melting permafrost to ocean acidification, if
left unchecked, are going to create dire consequences for the planet.
TThe lead scientist from the Mexico/Germany research team (Dr. Paul Blanchon)
says in his report: "In our warming world, the implications of a rapid,
meter-scale sea level jump late during the last interglacial are clear for both
future ice sheet stability and reef development. Given the dramatic
disintegration of ice shelves and discovery of rapid ice loss from both the
Antarctic and Greenland ice sheets, the potential for sustained rapid ice loss
and catastrophic sea-level rise in the near future is confirmed by our discovery
of sea-level instability at the close of the last interglacial."
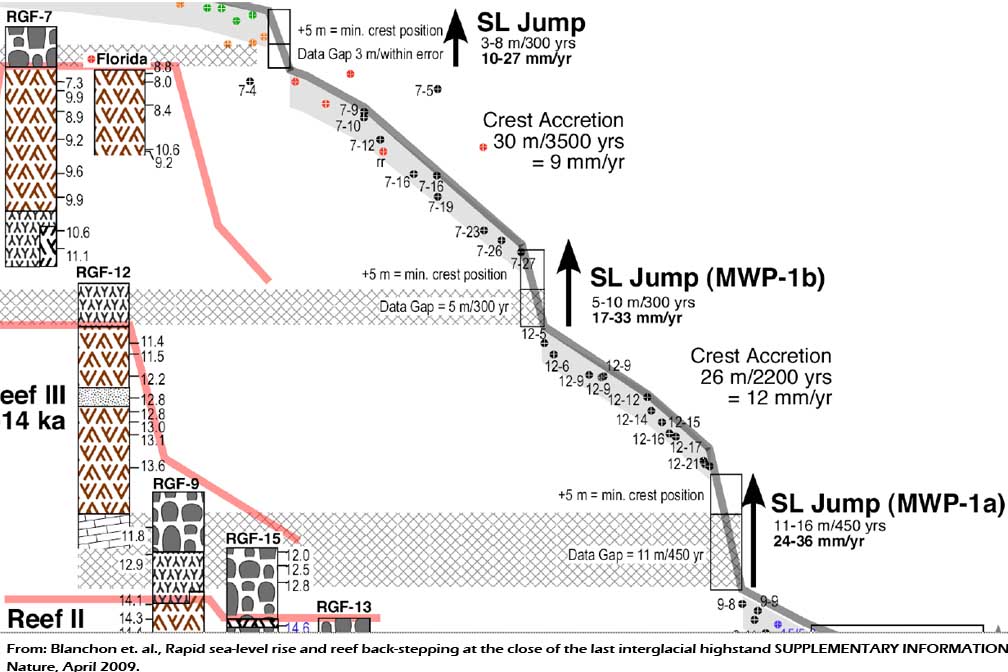
References:
Blanchon et. al., Rapid sea-level rise and reef back-stepping at the close of
the last interglacial highstand, Nature, April 2009.
http://www.nature.com/nature/journal/v458/n7240/pdf/nature07933.pdf
Fairbanks, A 17,000 year glacio-eustatic sea level record: influence of
glacial melting rates on the Younger Dryas event and deep ocean circulation.
Nature, 342, 1989.
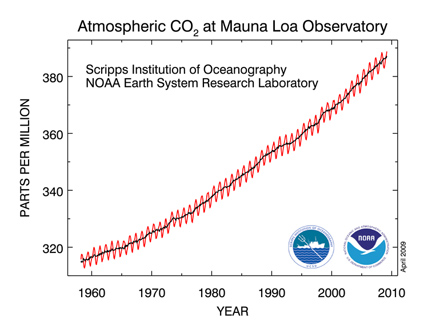 April
26, 2009 CO2 Climb Continues to Accelerate Despite
Economic Crisis Well it did not happen, at least not yet.
the economic crisis has not affected CO2 concentrations in the atmosphere. They
continue to rise at an even faster rate than just a few years ago.
The graphic on the right is probably familiar to most. This is the Keeling
Curve, developed by Dr. Keeling at Muana Loa in Hawaii. He started measuring CO2
when everyone thought he was nuts back in the late 50s. Well, Dr. Keeling turned
out to be the sane one...
April
26, 2009 CO2 Climb Continues to Accelerate Despite
Economic Crisis Well it did not happen, at least not yet.
the economic crisis has not affected CO2 concentrations in the atmosphere. They
continue to rise at an even faster rate than just a few years ago.
The graphic on the right is probably familiar to most. This is the Keeling
Curve, developed by Dr. Keeling at Muana Loa in Hawaii. He started measuring CO2
when everyone thought he was nuts back in the late 50s. Well, Dr. Keeling turned
out to be the sane one...
His graph of course is the telltale signature of climate change: that every
increasing curve trending off of the top of the chart. But this graph has always
left me a little underwhelmed. I took Dr. Keeling's data - the computed
annual CO2 concentration change donefont FACE="ArialMT" SIZE="3">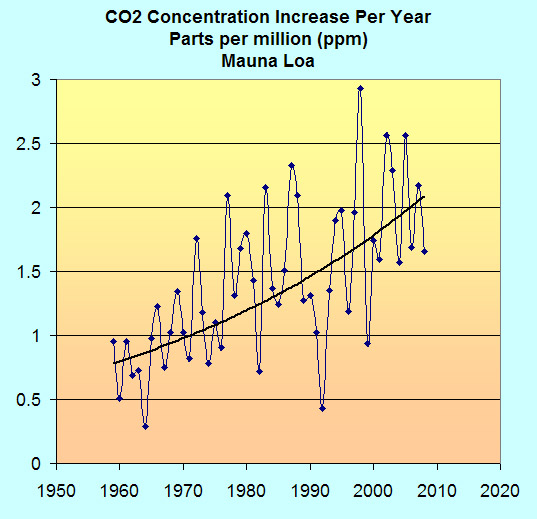 by NOAA's Earth Systems Research Lab (ESRL) and plotted them instead.
The blue line connects the part per million (ppm) change every year, which is
quite variable, but the black line is the trend, or the "smoothed" average.
About 1960 the concentration of CO2 in our atmosphere was between 0.7 and 0.8
ppm. Last year, it was almost 2.1 ppm.
While the increase in the Keeling Curve graph at the top (from less that 315 to
386 ppm) is about 23%, the increase of the rate that CO2 is increasing (bottom
graph) is nearly 300%! Why don't the scientists show us this image instead
of the one that has a 23% increase since 1960?
I have to repeat this it is so important: CO2 has increased 23% since 1960.
But more importantly, CO2 is increasing three 300% faster than it was in 1960.
The importance of the difference can not be understated.
http://www.esrl.noaa.gov/gmd/ccgg/trends/
April 25, 2009 The Wilkins Ice Shelf Continues its
Collapse 5,000 square miles
- an area large than the state of Connecticut. It started in February 2008 (the
end of the Antarctic Summer). It continued through the Antarctic winter
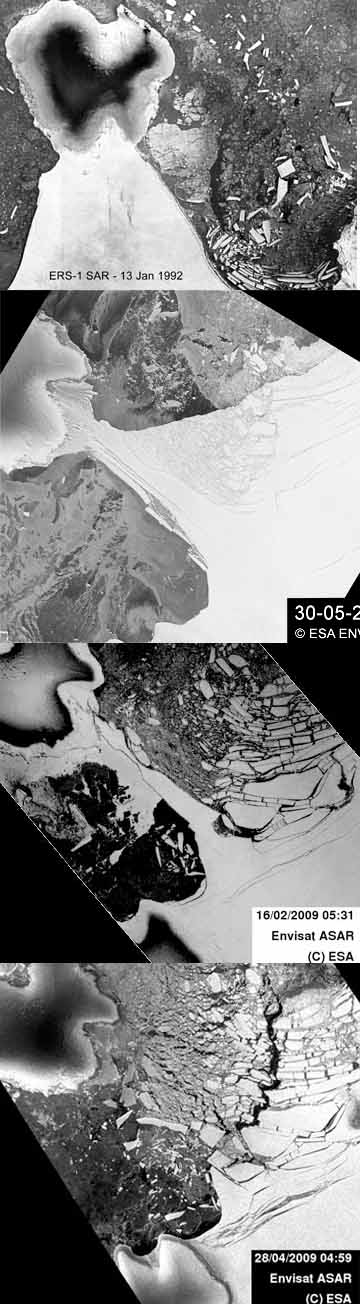 which
was a big surprise to scientists. That sort of thing had never happened before.
Last month the slender remaining ice bridge collapsed and the breakup has
accelerated.
which
was a big surprise to scientists. That sort of thing had never happened before.
Last month the slender remaining ice bridge collapsed and the breakup has
accelerated.
This is the tenth ice shelf collapse on the Antarctic Peninsula in two decades.
Scientists at the British Antarctic Survey say that this breakup, like the rest
is caused by global warming. This collapse however came from melting ice
on the bottom of the ice sheet - a foreshadowing of bigger things to come,
beginning already on the West Antarctic ice Sheet.
We still have a few ice shelves to go before the West Antarctic gets involved.
The Larson C for instance, is larger than Vermont and new Hampshire put
together. It is melting from beneath as well. Small changes in ocean
temperatures can do a lot of melting because of the great thermal capacity of
water.
Current thinking is that the Larson C has maybe 10 years left. The Larson B, the
size of Rhode Island, broke up in 2002 in 28 days because surface melt water
drained into thousands of crevasses and wedged them apart. The Larson C surface
is melting in summer now, that wasn't happening a decade ago.
Wilkins Feb 27, 2009
April 21, 2009 This is Just Funny (and sad)
It's from an article on Yahoo. "Ask 15 Republicans the same questions about
climate change and you get 20 different answers!" The author, Lisa Lerer says: in March,
Republican National Committee Chairman Michael Steele told a national
conservative radio program that the Earth is “cooling,” not warming.
After the EPA CO2 Endangerment Ruling, the article says: Republican leader John
Boehner dismissed as “almost comical” the idea that carbon dioxide is “a
carcinogen that is harmful to our environment”.
And finally, the New York times reports that the same guy, Congressman John
Boehner, Republican Leader in the House, thinks that cows fart CO2.
You can see for yourself, the interview with Ohio Republican Congressman John
Boehner and George Staphanopholus:
http://greeninc.blogs.nytimes.com/2009/04/21/boehner-calling-carbon-dioxide-dangerous-is-almost-comical/?apage=2
April 21, 2009 EPA CO2 Endangerment Ruling Press Release
"...Climate
change is an enormous problem.." Delayed for nearly a decade by the Bush Administration, as soon as
Obama came into office the EPA went back to work.
The Ruling states:
“This finding confirms that greenhouse gas pollution is a
serious problem now and for future generations... In both magnitude and
probability, climate change is an enormous problem." The press release goes on
to state:
"In addition to threatening human health, the analysis finds
that climate change also has serious national security implications. Consistent
with this proposed finding, in 2007, 11 retired U.S. generals and admirals
signed a report from the Center for a New American Security stating that climate
change “presents significant national security challenges for the United
States.” Escalating violence in destabilized regions can be incited and fomented
by an increasing scarcity of resources – including water. This lack of
resources, driven by climate change patterns, then drives massive migration to
more stabilized regions of the world."
There are no regulations connected to the "Endangerment Finding". It is the
initial action that leads to regulation. This is the same procedure that
happens, or happened with other dangerous byproducts of our human existence like
lead and ozone depleting chemicals. The EPA has stated that they would rather
control greenhouse gasses through legislation, which is likely not a good idea.
What this action has done however, is to allow science to rule our lives. If the
forthcoming legislation is as weak as it appears it is going to be, the EPA will
now have the tools available to appropriately regulate greenhouse gasses.
Press Release:
http://yosemite.epa.gov/opa/admpress.nsf/0/0EF7DF675805295D8525759B00566924
EPA Endangerment Summary Page:
http://epa.gov/climatechange/endangerment.html
Endangerment Finding:
http://epa.gov/climatechange/endangerment/downloads/GHGEndangermentProposal.pdf
EPA Technical Support: This is a great document (171 pages) about the current
state of our climate:
http://epa.gov/climatechange/endangerment/downloads/GHGEndangermentProposal.pdf
April 16, 2009 World's forests to become carbon
sources instead of carbon sinks within a few decades. A new mega
report by the
International Union of
Forest Research Organizations states the obvious. Persistent drought, insect
infestations and disease have increased just as the scientists predicted they
would over 20 years ago. These problems have already had enormous impacts on the
forests of the world and those impacts are increasing in severity and the
accelerating patterns are expected to only worsen.
IUFRO is "the" global network for forest science cooperation. It unites
more than 15,000 scientists in almost 700 Member Organizations in over 110
countries.
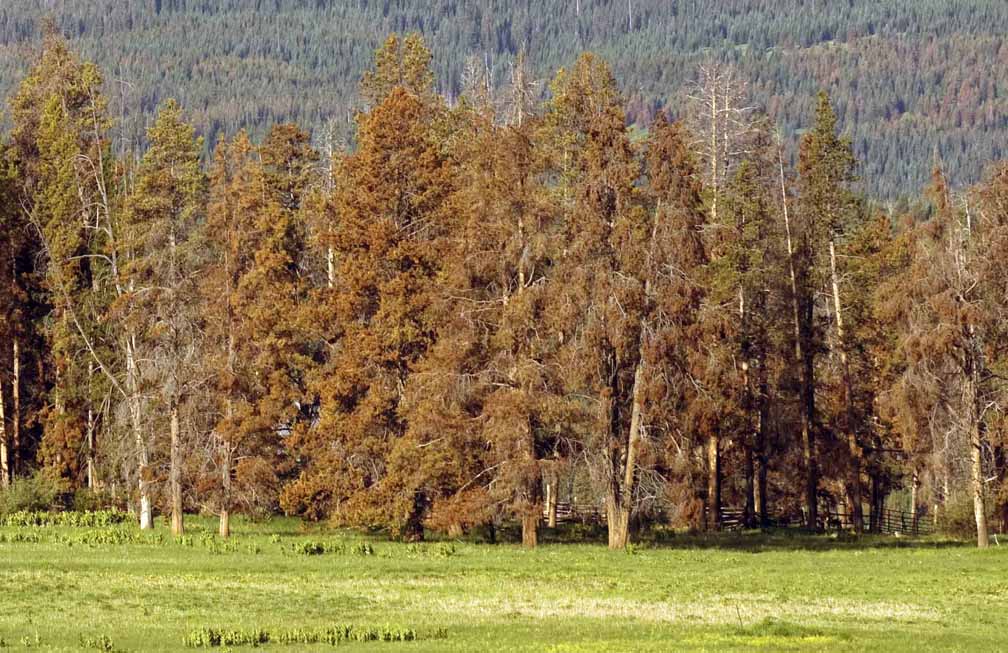
Most people have never heard that our forests are in trouble. Most folks have
never heard of the great pine beetle pandemic in the North American Rockies.(see
here)
It has killed 40 million acres of trees in a little more than a decade, or that
this outbreak is ten times larger than the last biggest outbreak that occurred
just ten years ago on the Kenai Peninsula in Alaska that was 3 million acres.
The photo above is from the Steamboat Springs, Colorado area in 2008. Over 2.5
million acres have been killed in Colorado. The Rocky Mountain Climate
Organization, The Colorado State Forest Service, the US Forest Service says that
all of the mature lodgepole pine forests in the U.S. Rocky Mountains will be
dead by 2012 to 2015. These forests represent 18% of all of the forests in the
U.S. Rocky Mountains. The forests of Canada are in even worse trouble. This is
where the bulk of the tree mortality has come from. In British Columbia alone,
30 million acres of trees are dead. In the next decade, another 10 million trees
will be killed at which time all of the food for the mountain pine beetle in BC
will be dead. The infestation has rapidly spread beyond BC in the last few
years.
Risto Seppälä, Alexander
Buck, & Pia Katila (Editors).
ADAPTATION OF FORESTS AND PEOPLE TO CLIMATE CHANGE – A
Global Assessment Report. Prepared by the
Global Forest Expert Panel on Adaptation of Forests to Climate Change.
International Union of Forest Research Organizations (IUFRO). World Series
Volume 22, April 2009.
April 15, 2009 The Problem is so Much Bigger...
What James Hansen, the most important climate modeler in the
world, has said about CO2 concentrations: that we need to reduce our CO2 levels
to 350 ppm. How are we going to do that with CO2 reductions? With a CO2
tax? With cap and trade? Taxes, caps and trades, increasing
efficiency, using less energy to start with - all of these things reduce the
rate at which we are putting CO2 into the air.
We need to be taking CO2 out of the air. This is a true emergency. We need to e
defending our country like this was a world war because it is. this is a war for
the survival of our world.
Today's CO2 concentration is 387 ppm and increasing at 3% per year, and this
increase has accelerated markedly since the turn of the century. To get to 350
ppm from 387 ppm we have to take CO2 out of the air. We cannot decrease the
amount of CO2 that we are putting into the air unless we take more out than we
are putting in. It is simple math.
Sure, natural processes take CO2 out of the air, but that takes a long time. CO2
has a half life of 300 years (not 200 years). this means that after 300 years,
half of the cCO2 put into the air on a given day is still there. Half of
that CO2 that was left will stay in the air another 20,000 years, and the rest
will stay there, basically until the end of time.
The reason that CO2 has a half life of 300 years instead of the 200 years that
we understood at the end of the 20th century, among other things is that our
oceans are warmer. They absorb less CO2 as they warm. Our forests have
passed the CO2 fertilizer effect and their absorption of CO2 is slowing. Our
land masses are drying out under persistent drought conditions, they absorb less
CO2 if they are drier.
As our oceans continue to warm, our forest continue to decline and our land
masses continue to dry, CO2 become even more difficult to be removed from our
atmosphere naturally.
Hansen 350 PPM see
here
April 13, 2009 Total loss of Arctic sea ice,
winter and summer, because of irreversible non-linear feedback
We don't know more about our climate than we do know. I just read a paper about
the Arctic in the Proceedings of the National Academy of Sciences that says that
basically the albedo feedback and an ice free summer in the Arctic could and
eventually will lead to an ice free winter too. The implications for climate are
immense. The Arctic is part of the Earth's refrigeration system. The ice up
there has been there for 14 million years without a break.
See here
Apparently, the ice covered Arctic Ocean is stable and a seasonally ice covered
Artic Ocean is not stable. We are transitioning to this seasonably covered
state now. It may be just a few years or a few decades, but it is close at hand,
and it is happening 50 to 70 years ahead of schedule.
Next, the authors do not know when, but they do understand that the change from
a seasonally ice covered Arctic Ocean to a completely ice free Arctic Ocean,
summer and winter, will occur unexpectedly and irreversibly at some point.
It's called a bifurcation response, or tipping point or threshold.
Because ice reflects 93 percent of the sun's energy harmlessly back to space and
open water absorbs 90 percent of the sun's energy and turns it into heat that
hangs around, the warming differential is huge. More water means a lot
more warming, which melts more ice, etc. Finally, at the bifurcation point, the
water gets so warm that ice will not form in winter.
This is all part of the polar amplification effect that we see happening today.
The new discovery is that a winter ice free condition will happen abruptly and
unexpectedly. And if this occurrence is like most any other climate change
related event in the last decade, it will happen much sooner than expected.
Eisenman and Wettlaufer, Nonlinear threshold behavior during the loss of Arctic
sea ice, PNAS, January 2009.
http://www.gps.caltech.edu/~ian/publications/Eisenman-Wettlaufer-2009-incl-SI.pdf
April 7 Arctic Sea Ice Thinnest Ever
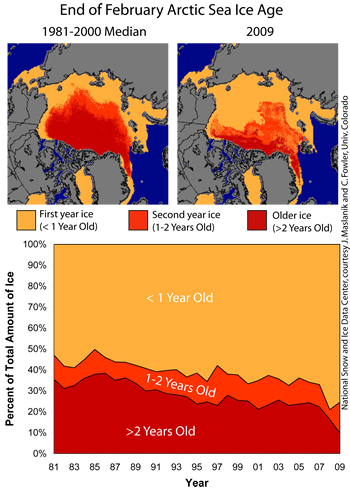 Only
10% of Arctic Sea ice is is older than two years old. The maximum coverage of
sea ice this winter was the fifth lowest ever recorded (The six lowest winter
ice coverage totals have all occurred in the last six years.) First year ice,
ice that melts every summer, makes up 70% of Arctic sea ice.
Only
10% of Arctic Sea ice is is older than two years old. The maximum coverage of
sea ice this winter was the fifth lowest ever recorded (The six lowest winter
ice coverage totals have all occurred in the last six years.) First year ice,
ice that melts every summer, makes up 70% of Arctic sea ice.
The albedo feedback effect may have taken over the Arctic. Albedo is the term
scientists use for the reflectivity of a surface. Ice reflects up to 93% of the
suns energy harmlessly back into space. Water absorbs over 90% of the suns
energy where it stays on Earth as heat.
Some of the heat absorbed as more ice melts stays in the ocean and causes the
winter freeze to create thinner ice. At some point, enough heat is absorbed
during the summer so that no ice forms in winter - the water is just too warm.
There are no scientists that are yet predicting the loss of winter ice
in the arctic, but it has been just recently that science has discovered that
summer sea ice in the arctic has been present for over 14 million years.
(see here)
http://www.nasa.gov/topics/earth/features/arctic_thinice.html
US Army Engineer Research and Development Center, Cold Regions Research and
Engineering Laboratory
Loss of sea ice in the Arctic -
http://www.crrel.usace.army.mil/sid/personnel/perovichweb/DKPpdf/annurev.marine.010908.pdf
April 5, 2009 The Only Thing Worse Than Climate
Change is the American Publics' Perception of Climate Change
Over 97% of climate scientists understand that humankind has been a
significant contributor to rising temperatures across the planet yet 42% of
Americans believe there is a lot of disagreement between climate scientists.
Polls and surveys tell us a lot of things. They all do not tell us the same
things, but they often do not ask the same things either. We learn
generalities as well as specifics from polls and surveys. We start to understand
just what it is that the public is thinking and in some cases we even begin to
understand why the public is thinking the way that the polls suggest. We
understand that for an individual, reality is what that individual is thinking.
Across all countries, an average 90 percent say that “climate change or global
warming due to the greenhouse effect” is a serious problem, but
60% believe that climate change will NOT pose a
serious threat to them in their lifetime and
41% of Americans believe that the press is exaggerating the issue of climate
change. (See
here)
Almost 60% of Americans believe they have a "fairly good" understanding of
climate change, but 69% believe that
reduction of atmospheric ozone is a major cause of global warming. *
Global warming ranked 8th out of 8 environmental issues with Americans and 20th
out of 20 top issues in America.
References:
* Ozone:
This confusion was created because the discovery of the ozone hole over
Antarctica and general atmospheric ozone depletion occurred coincidentally with
the popular understanding of global warming. Ozone is a greenhouse gas and one
of the more unstable of the atmospheric gasses. Because it is a greenhouse gas,
reduction of ozone actually cools the atmosphere. It is the other complex
relationships between ozone and other gasses in the atmosphere as well as other
environmental processes that create warming from a reduction of ozone. The
cooling and warming effects tend to somewhat cancel each other out although
there is not yet a thorough understanding of ozone in our atmosphere. Overall we
know it is a minor contributor to global warming, not a major contributor as is
suggested by the polling.
Increased Number Think Global Warming Is “Exaggerated”
http://www.gallup.com/poll/116590/Increased-Number-Think-Global-Warming-Exaggerated.aspx
Doran and Zimmerman Examining the Scientific Consensus, EOS Jan 2009.
http://tigger.uic.edu/~pdoran/012009_Doran_final.pdf
30-Country Poll Finds Worldwide Consensus that Climate Change is a Serious
Problem
http://www.worldpublicopinion.org/pipa/articles/btenvironmentra/187.php?nid=&id=&pnt=187&lb=bte
UN Human Development Report 2007 / 2008,
Fighting Climate Change: Human Solidarity in a Divided World,
Executive Summary.
UN Human
Development Report 20072008 Fighting Climate Change Human Solidarity in a
Divided World_summary_english.
Rutgers CSP Poll November 9, 2008.
http://www.csp.rutgers.edu/csp-posts/archives/38
Economy, Jobs Trump All Other Policy Priorities In 2009.
http://people-press.org/report/485/economy-top-policy-priority
April 3, 2009 Sunspots at 96 Year Low
We are at the bottom of the 11 year sunspot cycle and this is the longest period
that we have seen with the fewest sunspots in 96 years. Sunspots are hotter than
the rest of the sun - somewhat counter intuitively, they look black, but they
give off more energy. That energy warms the Earth. The amount of reduction is
0.02 to 6% less depending on the wavelength - which does not appear to be much
either. The sunspot minimum cools the Earth by about a half a degree F. on
average, because this one is a little stronger, the cooling may be a little
stronger too. But remember, a little goes a long way with the Earth's climate.
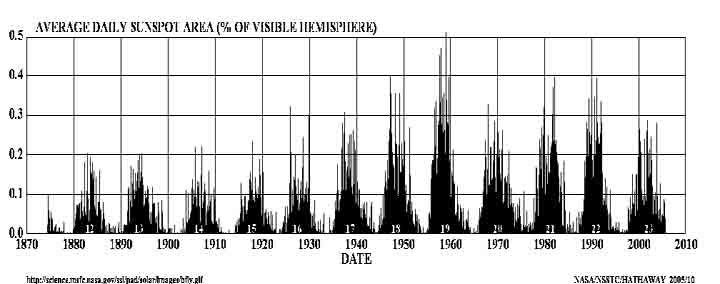
Radio energy emission (the sun emits radio waves too) are at a 55 year low.
Another thing that happens is that less solar winds are created during these
periods. Solar wind energy is at a 50 year low. Less solar wind actually shrinks
our atmosphere because it doesn't blow away as much of the cosmic rays from deep
space that act to swell our atmosphere in some way. This is still foreign to my
understanding nevertheless, our atmosphere shrinks. Could this be one of the
reasons why our climate cools during sunspot minima? Outer space is closer? our
Earth's insulation blanket is thinner?
We have also likely just entered the "Cool Phase" of the Pacific Decadal
Oscillation. This is 20 to 30 years cycle in the Pacific that is understood
about as well as the rest of climate science; at least we know more today than
yesterday. The "Cool Phase" however, is not called a "cool phase" because it is
warmer than normal. And, La Nina continues in the Pacific as well. It is
gradually weakening and is supposed to go neutral by early summer.
So the blizzards across the Plains in the U.S. continue and the public's
understanding of global warming is obfuscated by natural climate variations.
I am working on a piece about public viewpoints about climate change.
Nearly half of the U.S. population (42%) believes that that the media is
exaggerating, but the media is asleep for goodness sakes. Stay tuned, the piece
will be up in a few days.
On a similar subject, I read another paper yesterday about global warming
causing persistent La Nina conditions instead of the well accepted persistent El
Nino hypothesis. This would be a flipping mechanism where the warmer global
temperatures force the ENSO (El Nino Southern Oscillation) to jump to a cool
state. Don't hold your breath.
Space Weather at NASA:
http://spaceweather.com/
April 2, 2009 U.S. GHG Reduction Bill (Waxman-Markey)
is a Shadow of Kyoto Kyoto Required the U.S. to reduce GHGs by
7% below 1990 levels by 2012. Since the Clinton Administration did not ratify
Kyoto, the task has become harder, not easier. Climate is changing faster, the
impacts are greater, the warming in the pipeline is greater and future impacts
will be greater and last much, much longer than understood during the Clinton
Administration. (See NOAA's Solomon here)
The first reading of the new climate legislation requires U.S. reductions of
greenhouse gases (equivalent to CO2) of 20% below 2005 levels by 2020. GHG
emissions in 2005 were 7130 gtons (gigatons = billion tons). this is the same
target as Kyoto had for the U.S. of 7% below 1990 levels (5,718 gtons). What
kind of progress is this? Much of the rest of the world - Most of the rest of
the world - is seeking reductions that are five to seven times greater than
Kyoto - not the same as...
The U.S. is far, far behind. Our 2007 emissions in the were 7,125 gtons.
China? No... CO2 hardly matters from year to year. It has a half life of
300 years. Half of the CO2 emitted by the US has been emitted since 1960,
so virtually all of it is still in the air. We have emitted 30% of all of the
CO2 emitted by every country on Earth since the beginning of the industrial
revolution. China is second at 8%, and it will be many decades before they
catch up to the US.
Of the remaining half of CO2 in the atmosphere after 300 years, not 100 or 200
years like we thought in the 20th Century. Those numbers were relatively correct
back then, but warming decreases the capacity of our CO2 sinks to suck up CO2.
Scientists are finding that the sinks are decreasing in efficiency faster than
expected, so the half life of CO2 has increased, as well as its 3/4 life and its
whole life. Half of the CO2 that remains in our atmosphere longer than 300 years
will stay there for 1,000 years, the other half will stay there 20,000 to 30,000
years.
CO2 emissions -
http://www.eia.doe.gov/oiaf/1605/ggrpt/index.html
CO2 half life - Archer, Fate of fossil fuel CO2 in geologic time, Journal of
Geophysical Research, 2005.
April 1, 2009
No Jokes Today:
Arctic Sea Ice has not been absent from the Arctic
Ocean in The summer in 14 million years So
much going on... A great paper slipped past
in February - It has been 14 million years since the Arctic has been ice free in
summer. The National Snow and Ice Data Center has declared the arctic sea ice
maximum for the winter. It is the 5th lowest on record, and the lowest 6
years ever recorded have all occurred in the last 6 years.
The current Arctic sea ice projections are that we will see ice free conditions
in the Arctic sometimes starting between 2013 and 2020. With the sunspot
cycle and La Nina waning, it will be just a few years until the ocean
oscillations re-align themselves so that the warming mask is removed. The
anticipated continuance of accelerated warming coinciding with accelerated CO2
emissions and greenhouse gas feedback reactions is universal among climate
scientists.
The implications of an ice free Arctic Ocean are significant while in reality
being quite unknown. Fourteen million years is along to time to hind cast.
What is known is that open ocean absorbs 93% of the suns heat while snow absorbs
7%. So an ice free Arctic will retain 13 times more heat than we have seen
retained in 14 million years. It is understood that this heat is easily
transferred to adjoining land masses and this could be one of the reasons that
drive the polar amplification process that sees climate change happening first
in the arctic and happening with much greater impacts.
Loss of Sea Ice in the Arctic, US Army Engineering Research Center Cold Regions
Research and Engineering, 2009
http://arjournals.annualreviews.org/doi/full/10.1146/annurev.marine.010908.163805
April 1, 2009 Dr.
Katey Walter back from Siberia - Melt Lakes
are 5 times the size were just two years ago
Part of Dr. Walters research involves winter
time excursions to frozen over permafrost melt lakes to measure the trapped
methane beneath the ice. She recently returned from her Siberia project and
reported that the size of the melt lakes had increased five times in her two
years absence. Make sure to see her research videos. This is real survivorwoman
climate research - she blows things up!
http://www.alaska.edu/uaf/cem/ine/walter/ I have also put together a
string of fantastic Artcic climate change related videos here.
http://www.meltonengineering.com/Misc Polar Videos.swf
March 31, 2009 More Quotes from Lord Stern -
"Recklessness is the only word..."
From the Guardian, the UKs third largest daily, the Sunday edition of the
Guardian is called the Observer and is the world's oldest Sunday newspaper.
(March 30, 2009)
Lord Stern's background can be found here. The
following quote references Lord Sterns report in October 2006:
"When it came out, people thought I'd over- egged the omelet. But all the
things people were looking at turned out to be worse than they thought. Doing
nothing looks even more reckless than it did even a few years ago."
(The Guardian article says) He pauses, as if uneasy with such an intemperate
word, but keeps going. "Recklessness is the only word. I mean, we have to
recognize the scale of the risk. If we go on at anything like business as usual,
we'll be at concentration levels by the end of this century which will give us
around a 50-50 chance of being above five degrees centigrade relative to, say,
the 19th century. We humans are only 100,000 years old. We haven't seen that for
30 to 50 million years. We haven't seen three degrees centigrade for three
million years. The idea that humans can easily adapt to conditions like these
..."
(The Guardian continues) He lets the proposition tail away, too foolish even for
words. "What will we do? We'll move. People will move. Why? Because much of
southern Europe will be desert. Other places will become underwater. Others will
be hit by such severe storms with such frequency that they become almost
uninhabitable. So hundreds of millions of people will move. You're already
seeing people moving in Darfur, where droughts devastated the grazing land of
pastoralist people, and they moved, and come into conflict with people in the
places they're moving to. We're seeing that already on just a 0.8 degree rise.
We're the first generation that has the power to destroy the planet. You're
re-writing the planet. So you can only describe as reckless ignoring risks like
that."
Sterns analysis is based on a simple idea. If the science is correct, the costs
of mitigation would be a fraction of the cost of not preparing and reacting to
the impacts. If the science is wrong, the new low carbon costs would be
"very far from disastrous", and the world would be better off "because
we will have a world that is more energy efficient, with new and cleaner
technologies, and is more biodiverse as a result of protecting the forests".
When Stern was asked if the science could be wrong the reply was "It's very,
very remote," when asked if it would be less than one in 100 "Oh, much,
much less."
http://www.guardian.co.uk/environment/2009/mar/30/climate-change-nicholas-stern-interview
Breaking News Archive March 29, 2009
Breaking News
Archive December 11, 2008